10.01.2018 by Anete Ezera
Last year was Infogram’s most epic year to date. We made huge changes to our data visualization tool, our co-founder Alise Semjonova made the prestigious Forbes 30 Under 30 Europe list, we won the National Design Award of Latvia, and of course – we happily joined the Prezi family.
We’re ready for an even better 2018, but before we get started, let’s take a closer look at all that was accomplished over the past 12 months (feature lovers, this is for you):
10 Exciting Fresh Features
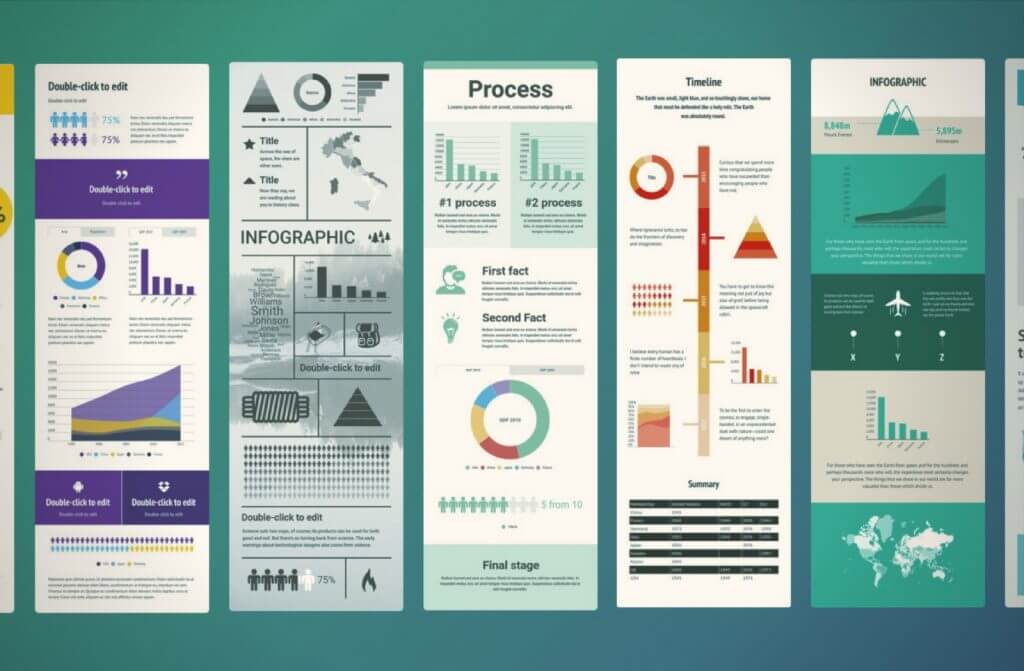
New Design Experience – In October we announced the most powerful, versatile redesign in Infogram history. Our intuitive, flexible drag-and-drop editor lets you place elements freely in your project. Elements that you can resize, overlap, and combine to create stunning visuals in minutes.
Project Templates – Enjoy beautiful designer templates, which make it easy to turn ideas and data into engaging content. Our templates help teams quickly create interactive multi-page reports, dashboards, infographics, and social media images.
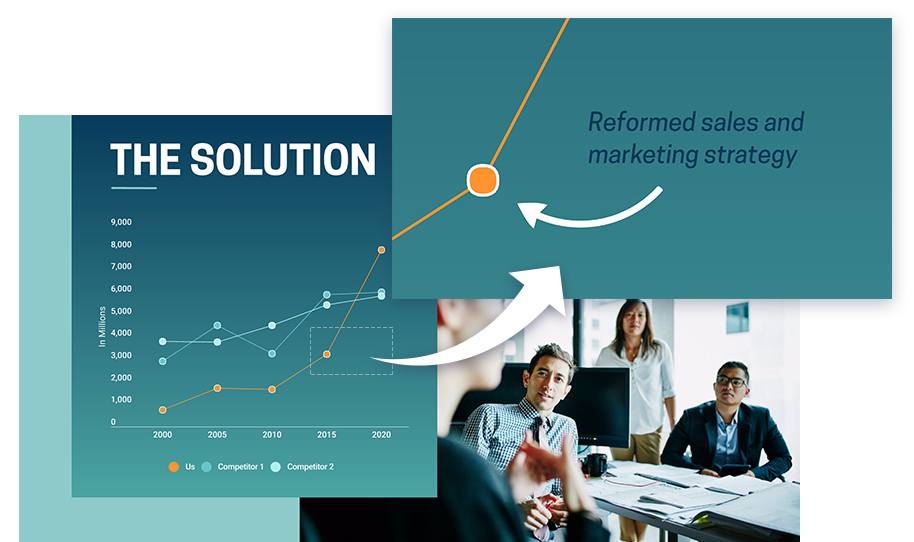
Infogram + Prezi = ❤️ – Infogram and Prezi engineers worked hard to make beautiful data presentations a reality. With Prezi Plus or above, you have native access to Infogram’s most popular charts. We’ve proven that data is powerful and so is a good narrative, but together they’re unbeatable.
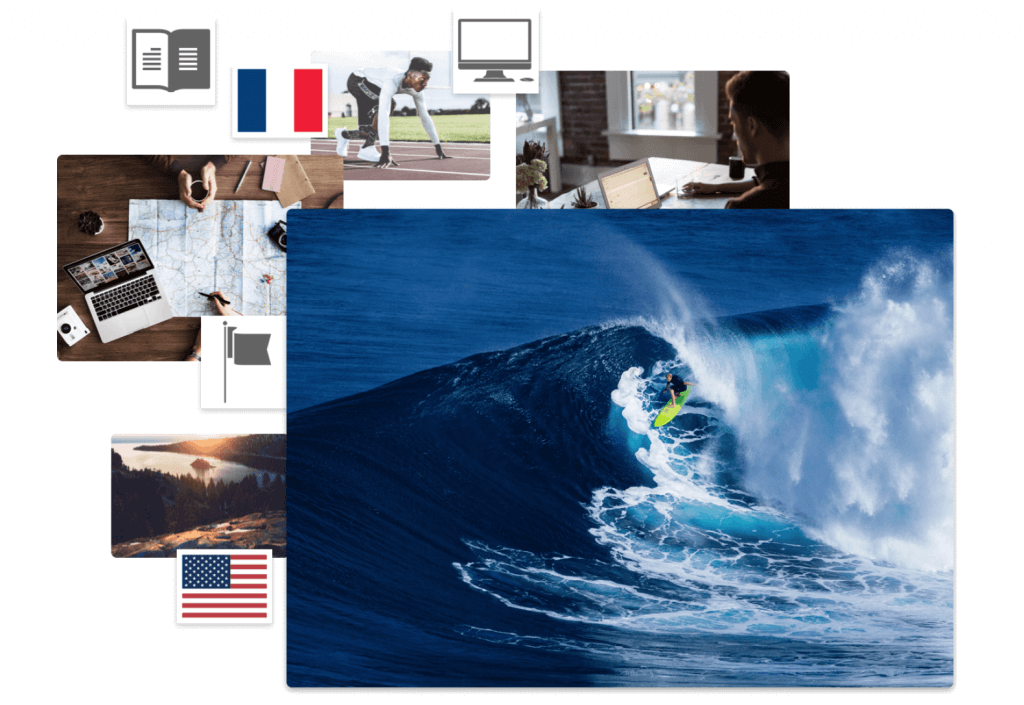
Images, Icons, and Flags – Infogram now offers over 1 million ready-to-use images, 500,000+ icons, and a large selection of official flags. It’s easier than ever before to quickly search and add visuals to your work. You can look through our huge image library for pictures, icons, and flags that are free to use anywhere.
New Maps and Settings – Our sophisticated mapping tool transformed last year, at your request. We added new maps, region names for clarity and depth, legend customization, font resizing for readability, and tile layers for a more realistic feel. To learn more about maps, watch our free webinar.
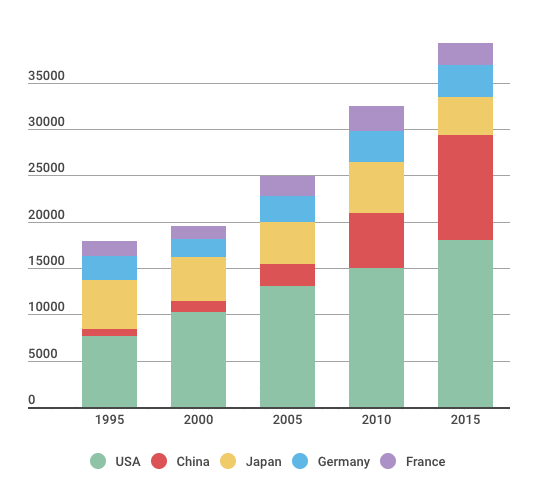
Interactive Chart Legends – Your viewer has the ability to dive into your data with Infogram’s interactive chart legends. They can select and deselect various categories, giving them the option to view the datasets most interesting to them. This feature is available with stacked bar, stacked column, and other charts.
Linked Charts – Switch between multiple, related datasets in just one click. You can link charts to create more compelling, interactive reports and infographics. Make sure your objects have the same tab names when you enable this feature in the settings.
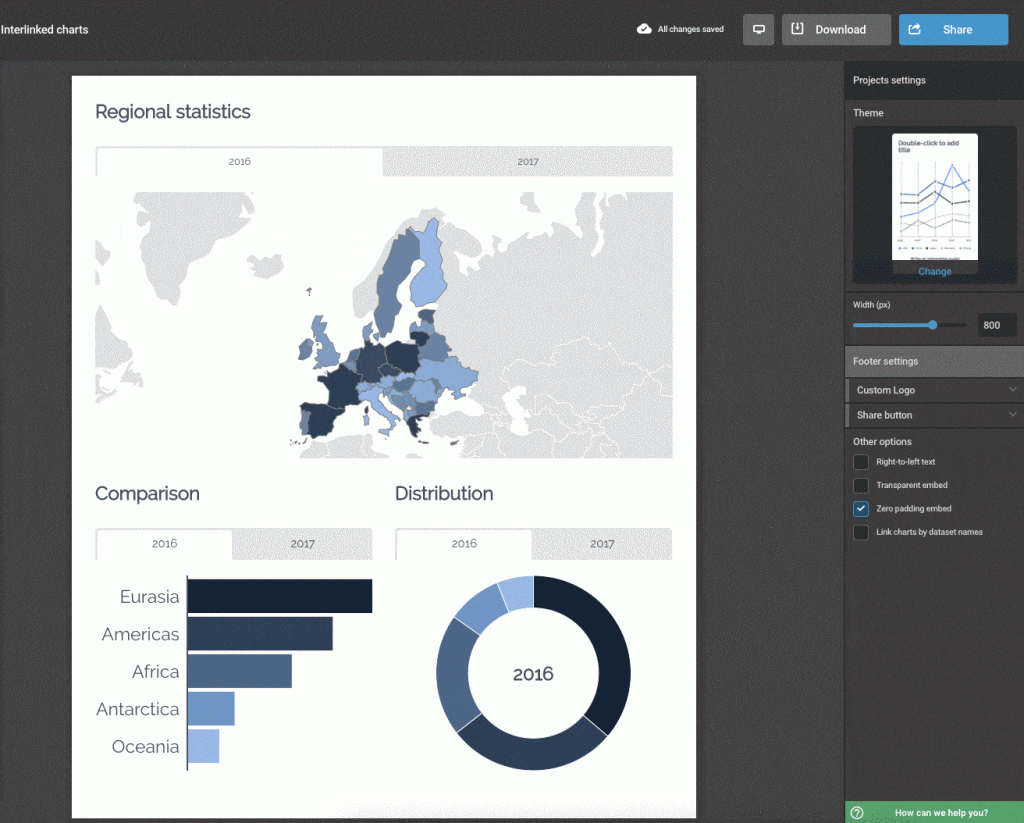
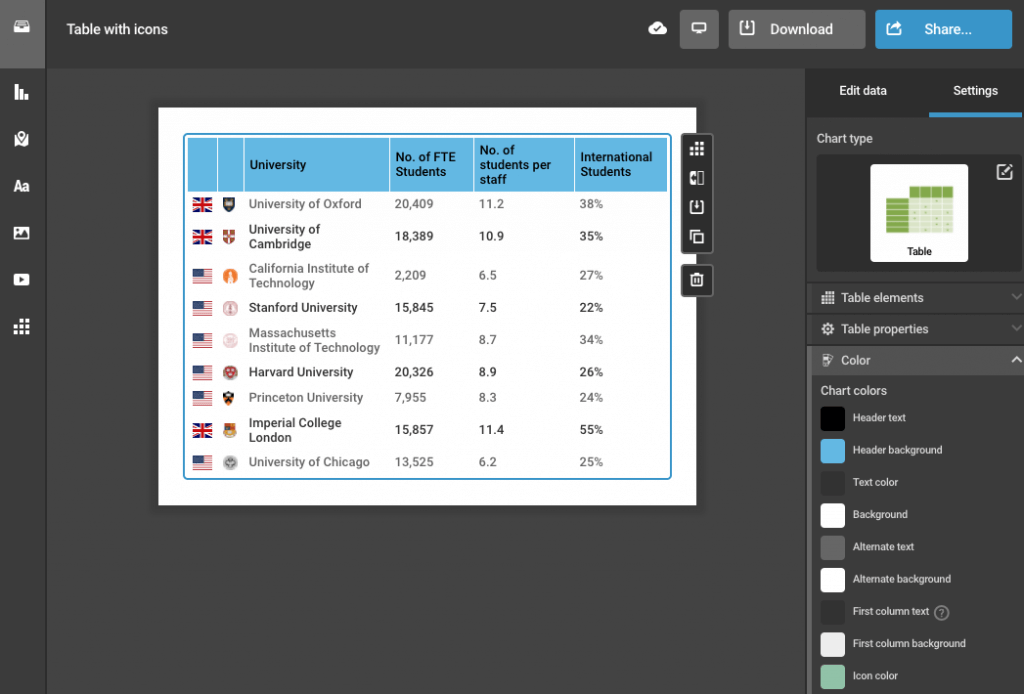
Table Customization – Now you have even more options to customize and perfect your tables by changing chart colors, text alignment, text size, shapes, and chart height. You can even add images and merge cells for full creative control.
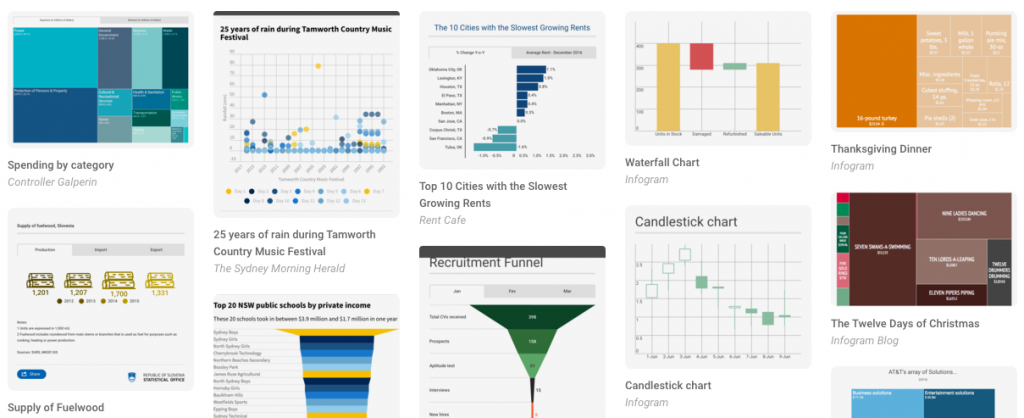
Inspirational Examples – We’ve hand-selected a wonderful collection of impressive charts, infographics, reports, presentations and maps created by Infogram users. You can browse any chart type or enjoy featured projects.
Faster Loading Time – Infogram is proud of our ongoing commitment to help users make beautiful charts that load quickly. We’ve made chart loading time up to 30% faster! That means your chart embeds will display in no time, which increases viewer engagement and the overall visualization experience.
We know you can’t wait to design amazing data visualizations in 2018, and we can’t wait to help you tell better data-driven stories. From the Infogram team to you – Have a wonderful year! ????
Get data visualization tips every week:
New features, special offers, and exciting news about the world of data visualization.