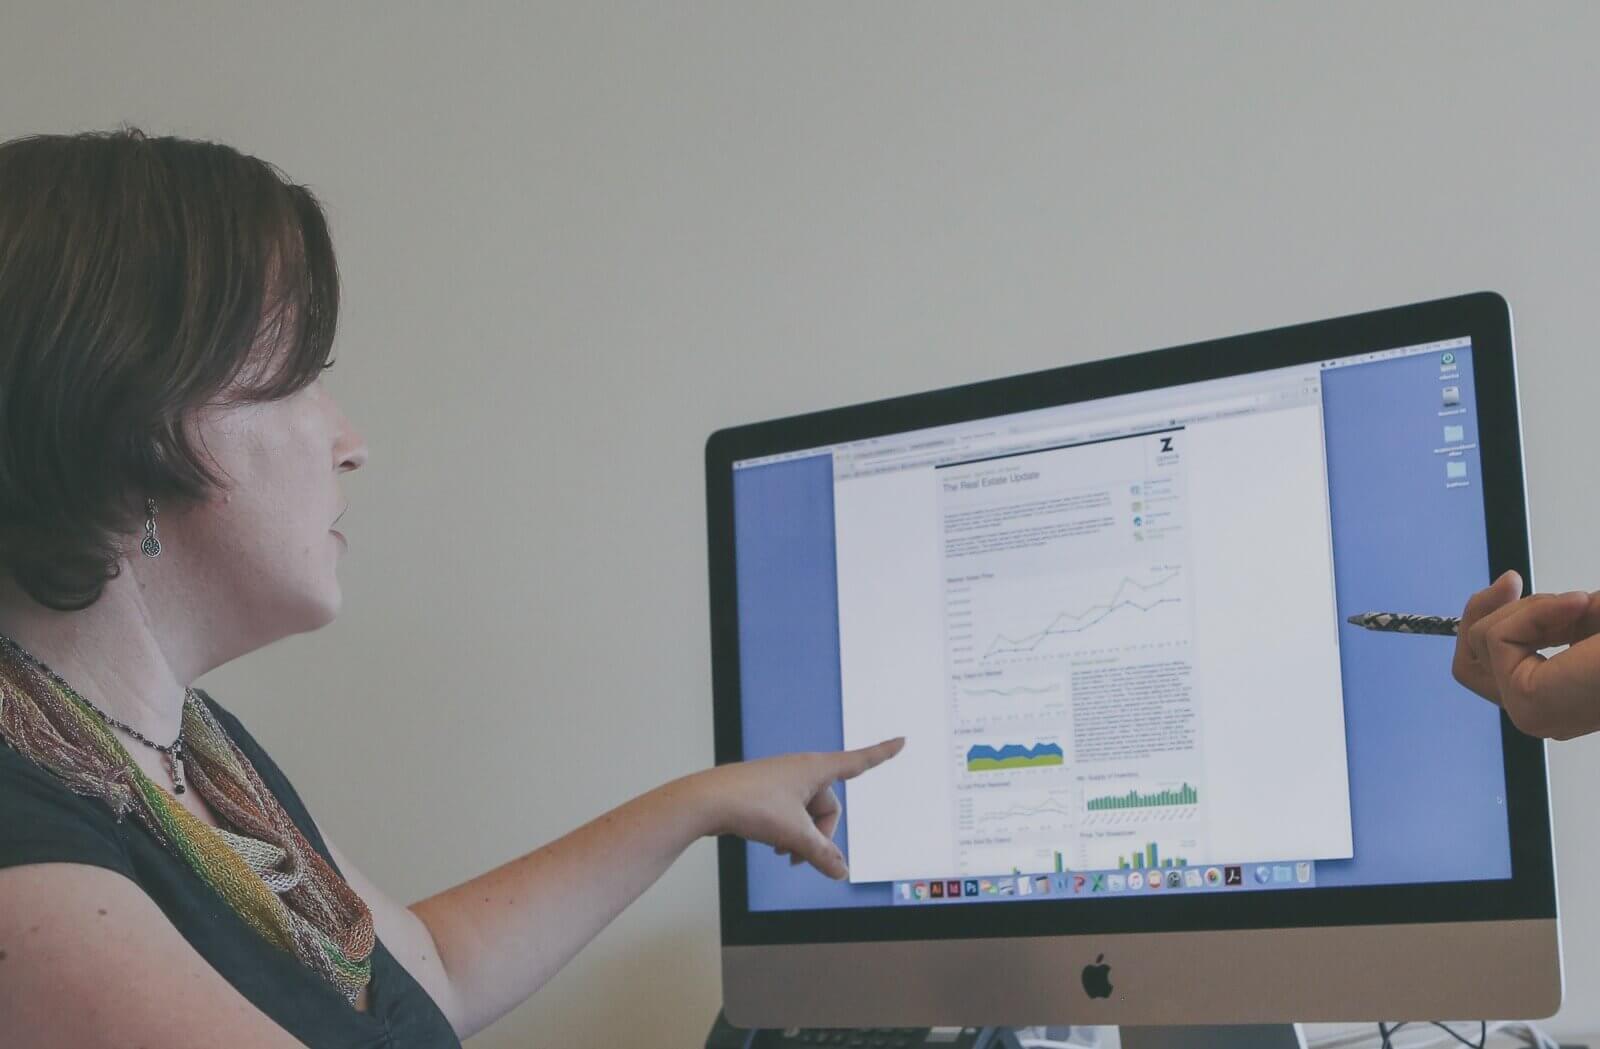
Data visualization is a crucial capacity for news media. Factual stories often contain complex data that are pivotal to the story. Only a correct, efficient visualization of the data can turn it into information that can then be widely communicated and consumed.
Fairfax Media is the second largest publisher in Australia and New Zealand. Its flagship media The Sydney Morning Herald has been published continuously since 1831 and is Australia's number one news outlet. Fairfax Media's portfolio includes news publishing, magazines, radio, and digital properties such as Huffington Post Australia, Stuff.co.nz, and Australian licenses for Gizmodo and Lifehacker. In terms of online properties, Fairfax Media is number two in Australia – Google is number one, and Facebook number three.
Matt Martel is the Executive Editor, Presentation and Photography at Fairfax Media, responsible for top properties such as The Sydney Morning Herald, The Age, and The Australian Financial Review.

"At Fairfax Media, we've been getting our reporters to be more visual, and we're having great success with this," Matt says of the motives behind data visualization at Fairfax Media. "When we have a visual element on the page, telling the story, we have an additional engagement point for our audiences. As a result, readers spend more time on the page. We expect the engagement with the page to roughly double when we implement a new technology like this, and we're seeing these results with Infogram."
Fairfax Media had an interesting journey picking the right tool for the job, and it shows off Infogram's key benefit well.
"We first looked at Infogram to replace an existing supplier," says Matt. "First we spinned an open source solution, but that didn't work for our needs. I don't want to have three to four developers creating and maintaining a system when I can have an off-the-shelf product that perfectly meets our needs."

"We did a five-minute test with 12 products," Matt says of the selection process. "We gave a reporter five minutes to create a data visualization for a story, without previous knowledge of the system." In the end there were only two new products that made the cut: Infogram, and a competitor (who has since then been acquired and is no longer available).
Infogram's development speed and responsiveness were also decisive factors. "We picked Infogram due to the ability to customize and to act quickly on our needs and suggestions. We've loaded our own maps, styles and have been expanding our use of the different chart types offered by the product," Matt says.
There are a vast variety of projects in a newsroom, usually with tight deadlines. What Infogram allows the newsroom to do with data visualization is to take all the easy and middle-complexity visualizations and make them all fast and simple. "Our developers can focus on the big, unique and high-end content. Infogram takes care of the rest. Where some projects would have in the past taken a day or two, it now takes us 15 minutes to get the same job done," Matt says. In general, Infogram is part of a stack of subscription solutions that simplify and streamline the majority of content creation, and empower everyone across the organization to use visuals to tell their story.
At The Sydney Morning Herald, Matt says that tools like Infogram also allow them to focus what they are best in. "We've learned that we're not a software development company. We're an editorial newsroom."


"Everyone from reporters to producers to graphics people use Infogram to create charts and visualizations," Matt says. "Even some of our project managers use Infogram for dashboards and business intelligence."
A good data visualization needs no instructions. "If it adds to the story – or if it is the story – it works," Matt says.
The idea for Infogram was born in a newsroom environment, so we're doubly excited to count Fairfax Media as a customer. At Infogram, we want to make data visualization, publishing and communicating with visual information easy, beautiful and efficient.