
Import Your Data Effortlessly
Easily import data from various sources and transform it into stunning visualizations!


4.7 out of 5 stars


Overview
Why
Types
Examples
Reviews
Tips
FAQ
Seamlessly Import Data
In today's data-driven world, importing and managing data efficiently is essential for businesses to make informed decisions and effectively communicate information. With Infogram, you can seamlessly bring in data from various sources and transform it into stunning visualizations that captivate your audience.
Infogram offers multiple data import options to suit your needs. You can easily import data from popular online databases, allowing you to connect directly to your data source and visualize it in real-time. Not only that, but Infogram also enables you to import data from external sources like Google Drive or JSON feeds.
Experience the ease and efficiency of Infogram's data import feature. Unlock the power of your data and transform it into compelling visual stories that resonate with your audience. Join thousands of satisfied users who trust Infogram to bring their data to life.
4 Reasons to Try Infogram Data Import Today
Discover the reasons why you should try Infogram and revolutionize your visual content.

Reduce Manual Work
Importing data from external sources significantly reduces the need for manual data entry and updates. Manually inputting data into a visualization tool can be time-consuming and error-prone. With data import, the process is automated, saving you valuable time and reducing the risk of human errors.
This is particularly important for complex datasets that are large or require frequent updates. By eliminating the need for manual data handling, you can focus more on analysis and interpretation, leading to more meaningful visualizations.

Get Real-Time Insights
Connecting to live data sources enables you to create visualizations that respond in real-time to changes in the underlying data. This is especially valuable for monitoring trends and patterns as they happen.
For example, a business tracking website traffic could visualize the number of visitors in real-time, allowing them to make immediate decisions based on current data. Real-time insights empowers you to react promptly to emerging opportunities or challenges, enhancing your decision-making process.

Provide Accuracy and Consistency
Direct data imports eliminate the potential for errors that can occur during manual data entry or copying and pasting. Manually inputting data can introduce typographical errors, inconsistencies, and data formatting issues that may impact the accuracy of visualizations.
By sourcing data directly from databases or files, you ensure that the data used in your visualizations is accurate and consistent. This is crucial for maintaining the integrity of insights and reports generated from the data.

Ensure Efficiency and Automation
Automating the process of updating visualizations through data import increases efficiency. When using live data sources like MySQL, PostgreSQL, and others, you can schedule automatic updates at specific intervals. This eliminates the need for manual intervention each time new data is available.
Whether it's daily, weekly, or even hourly updates, automation ensures that visualizations are always based on the most recent and relevant data. This is particularly advantageous for time-sensitive projects where up-to-date information is crucial.
Data Import Options to Explore

MySQL
Import data directly from MySQL databases into Infogram to create dynamic visualizations that reflect real-time changes. Automate updates to your visualizations with accurate data from your MySQL database, saving time and ensuring consistency.

PostgreSQL
Seamlessly integrate PostgreSQL data into your Infogram projects for insightful visualizations. With direct data import, you can maintain accuracy and provide real-time insights that reflect the evolving trends in your PostgreSQL database.

Amazon Redshift
Leverage the power of Amazon Redshift by importing its data into Infogram. Create impactful visualizations that draw from your Redshift cluster, delivering real-time insights and enabling you to make data-driven decisions with confidence.

Oracle
Connect your Oracle database to Infogram and unlock the potential of your data. Use real-time data import to craft compelling visual narratives that accurately represent the insights within your Oracle database.

Microsoft SQL Server
Integrate data from Microsoft SQL Server seamlessly into your Infogram projects. By importing data from SQL Server, you can automate updates, ensure accuracy, and create visualizations that keep pace with your evolving data.

Google Drive
Easily import data from your Google Drive into Infogram for dynamic visualizations. With this integration, you can turn your spreadsheet data into impactful charts and graphs without manual data entry.

JSON Feeds
Incorporate external JSON data feeds directly into your Infogram visualizations. This feature allows you to create real-time and interactive visuals that respond to changes in the JSON data source.

Other External Data Resources
Infogram's flexibility extends to importing data from various external sources. Whether it's web-based APIs or custom data formats, you can seamlessly integrate your preferred data sources into your visualizations.
Get Inspired by Infogram User Created Projects

This Is Our Solar System

10 Years After the Deepwater Horizon Oil Spill

Floyd Mayweather Jr. Vs Conor Mcgregor

10 Largest Mining-Focused Funds to Have Closed Historically

FiveThirtyEight: Looking to November

Customer Survey Report

The Challenges of Remote Work

A snapshot of greater Portland's need for affordable homes
Customer Reviews
Here is what our customers have to say about us.
2022 Summer & Fall and 2023 Winter leader in Data Visualisation Software 4.7 out of 5 stars
See reviews on G2 ›Empowering 30,000+ Companies Worldwide
From startups to established enterprises, our platform has been embraced by a diverse range of businesses seeking to captivate audiences and simplify complex data. Here are just a few examples of the 30,000+ companies that use Infogram.


Learn More Practical Tips
Finance
A Practical Guide to Creating Financial Reports
Design
Map customization: 3 essential learnings to bring stories to your maps
Marketing
Data storytelling: Ingredients to an effective data story
Business
Comprehensive guide to creating annual business reports
Marketing
Marketing report: Everything you need to know to get started
Marketing
Progress report: What it is and how to write a progress report
Frequently Asked Questions
How to access your API credentials?
- Go to your Account settings page.
- Switch to the API tab.
Note: Using this feature will require some knowledge of PHP, Java, or Ruby programming languages. To use any of the premium features, such as downloading or live data updates, you'll need to have one of the subscription plans we offer.
How to connect to your Google Drive account?
- After you've added a chart or a map to your project, double-click on it to access the datasheet.
- Select Add Google Drive document at the top of the datasheet.
- When doing this for the first time, you'll have to connect your Google Drive account to Infogram.
- Choose the Google Drive document you want to use for your data visualization, then click Select.
- When you edit the information in your Google sheet, it'll automatically update your Infogram chart or map. The data are refreshed approximately every 10 minutes.
Note: Please keep in mind that if you rearrange the order of your tabs in Google Sheets, the corresponding tabs in your Infogram project won't automatically move. However, you can easily import data from Google Sheets by linking your document, and any changes you make in the linked document will be reflected in your Infogram project. Just be aware that if you rename tabs in your Google Sheets document, you'll need to manually update the tab names in your Infogram chart to ensure your data is correctly displayed.
How to connect to a JSON feed?
- After you've added a chart or a map to your project, double-click on it to access the datasheet.
- Select Add JSON feed at the top of the datasheet.
- Use this example to see how your JSON feed should be formatted. To create a multi-tab chart or map, use the following example.
- Now, when you edit the information in your JSON feed, it'll automatically update your Infogram chart or map. The data are refreshed approximately every 10 minutes.
How to connect to an online database?
- After you've added a chart or a map to your project, double-click on it to access the datasheet.
- Click the database icon at the top of the datasheet.
- In the dropdown menu, pick the database you want to connect to. Select MySQL, PostgreSQL, Amazon Redshift, Oracle, or Microsoft SQL Server database.
- Fill out the form.
- Click Update for the information to load.
How to add data to a chart?
Add data manually or by copy-pasting.
- To add a chart to the canvas, click Add chart in the left-side toolbar and select the chart you wish to use. Drag-and-drop the chart onto the canvas.
- Go to the Edit data tab in the Settings panel on the right or double-click the chart to access its data table.
- Click on a cell and start typing or use keyboard controls to copy-paste:
- Right-click a cell to access a menu with styling options:
Note: To access the option to Add/change link, you need to have a Business subscription or higher.
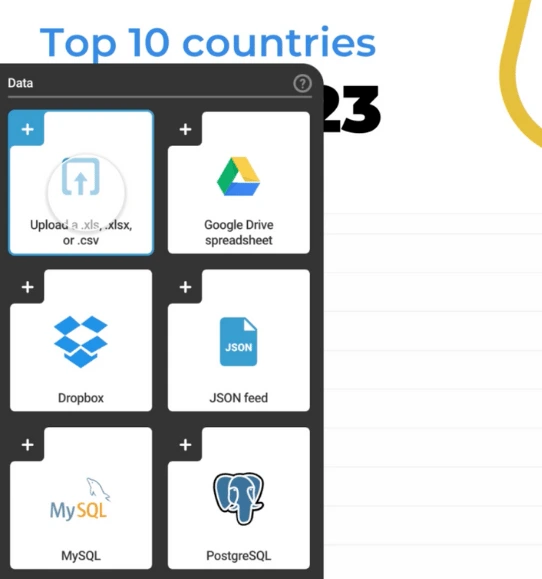
How to import data into your chart?
You can also import data into charts from your computer, Google Drive, Dropbox, or several databases. Infogram supports the following formats: .xls (.xlsx), .csv, Google Sheets, JSON, and databases (MySQL, PostgreSQL, Amazon Redshift, Oracle, Microsoft SQL).Note: Infogram doesn't support formulas, only raw data. If you import data from Excel, make sure it has only plain data in the cells, as the formulas won't work on Infogram.
- Go to the Edit data tab in the Settings panel on the right or double-click the chart to access its data table.
- Use one of the file import buttons above the data table.
To import your data into Infogram, you may need to give the platform access to some of your external data sources, such as Google Drive, JSON, and databases. This process involves creating a connection that allows for live updates. It's important to note that for data sources like your computer or Dropbox, you can only import files, and each time you need to update your chart, you'll have to re-upload the file.
Pro tip: Before importing your data into your chart, it's important to format it correctly. One important step is to choose the right decimal separator type for your data table, which you can easily do by using the formatting option located just above the chart's data table. Keep in mind that this setting only applies to decimals, not to thousands or millions. By taking the time to properly format your data, you can avoid errors and ensure that your chart accurately represents the information you want to convey.
Didn't find the answer? Check our FAQs

Try Infogram Now!
Are you ready to unleash the power of data visualization? Get started with Infogram today and create stunning, interactive content that captivates your audience. Elevate your projects and bring data to life.