27.08.2025 by Infogram
Infogram now includes an animated counter element, allowing you to display numbers that count up dynamically. This feature is designed to draw attention to key metrics, milestones, or statistics, making your reports, dashboards, and infographics more engaging.
Why It’s Useful
Numbers are often the heart of a story, but static figures can easily get overlooked. Animated counters bring those figures to life by gradually counting up to the final value. This not only makes the number stand out but also helps emphasize growth, change, or scale in a visually engaging way.
Whether you’re showcasing revenue, survey results, or key performance indicators, the animated counter helps ensure your audience notices and remembers the data.
What You Can Do With It
- Writers and researchers can highlight key findings in their reports, ensuring the most important figures don’t get lost in dense text or charts.
- Designers can use animated counters as a visual anchor in layouts, creating more dynamic and modern-looking projects.
- Managers and analysts can bring KPIs to life in dashboards or presentations, making updates and achievements clearer to teams and stakeholders.
How It Works
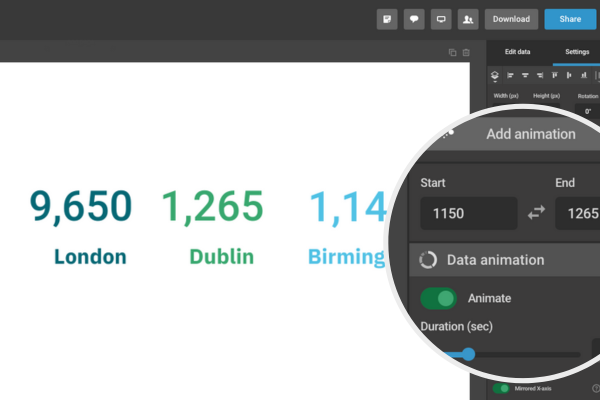
- Open your project in Infogram.
- From the left-hand menu, select Add text and choose the Number counter.
- Enter the number you want to display and on the right side menu adjust the data animation settings (Start and End).
- Customize the appearance – change the font, size, color, or position to fit your project’s design.
- Preview the project to see the animated counter in action.
Animated counters are now available for all Infogram projects. They’re a simple way to add motion and emphasis to your numbers, making data more noticeable and memorable. Open your project today and test the new counter element to highlight your most important metrics.
Get data visualization tips every week:
New features, special offers, and exciting news about the world of data visualization.