17.06.2025 by Infogram
You can now adjust the outline width in maps that use the icon mode. This update gives you more control over how borders and points appear, helping you create clearer, more tailored map visualizations – especially useful when working with dense or detailed geographic data.
Why It’s Useful
Maps are a key part of many data visualizations, grounding information in a geographic context. But depending on your design and the density of your data, default outlines may be too thick, too thin, or not visible enough. With custom outline width control in icon mode, you can now fine-tune your map’s appearance to suit your specific needs – improving both clarity and visual consistency.
This is especially helpful when presenting interactive content, embedding maps in reports, or preparing visuals for presentations where every detail matters.
What You Can Do With It
- Writers and researchers can create cleaner, more focused visual references when working with location-specific data.
- Designers can adjust outline thickness to match their visual style, keeping layouts consistent and polished.
- Managers and analysts can improve readability in dashboards and reports – especially when zooming in on detailed regions or highlighting performance across multiple locations.
How It Works
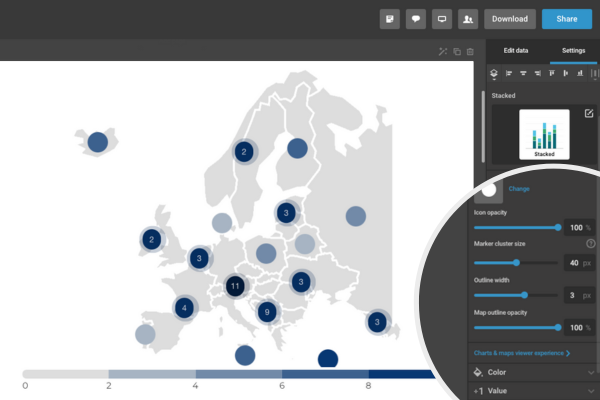
- Add a map to your project.
- In the right-hand menu, choose Map type and select Icon map.
- Scroll down in the same menu to find the Outline width setting.
- Adjust the width using the slider or input box.
- Your map will update instantly with the new outline setting.
Use this feature to apply subtle outlines for clean, minimalist layouts – or bold ones to highlight specific areas.
The outline width setting for icon mode maps is now available in all new and existing projects. It’s a simple way to gain more visual control without adding extra steps. Open any icon-based map in Infogram to adjust the outline width and improve how your data is displayed.
Get data visualization tips every week:
New features, special offers, and exciting news about the world of data visualization.