17.06.2025 by Infogram
Pie and doughnut charts now support multiline labels, making it easier to show longer category names and values in a clear, readable format. This update helps your charts stay clean and easy to understand – even when working with more detailed data.
How It Helps You
When a chart has multiple segments with long names or combined values, the labels can become hard to read. This new setting fixes that by allowing the text to break into two or more lines automatically.
You can now:
- Show longer category names without cutting them off.
- Stack the value and label on separate lines for clarity.
- Let the chart adjust its size to make space for the labels.
- Manually control the pie radius if needed for design purposes.
These options help your charts stay organized and easier to read, especially in dashboards, reports, and other data-heavy projects.
What You Can Do with It
- Writers and researchers can present more context directly in the chart, with clearer labels and no need for extra footnotes or sidebars.
- Designers can use the layout and size controls to make labels part of the overall visual balance.
- Managers and analysts can share insights more clearly, with readable segments and fewer distractions.
Whether you’re sharing customer segments, budget breakdowns, or survey results, multiline labels make it easier for your audience to understand your data at a glance.
How It Works
- Open a new pie or doughnut chart in Infogram.
- In the right-hand menu, go to “Chart properties”.
- Under section “Value and label alignment” choose an option side by side.
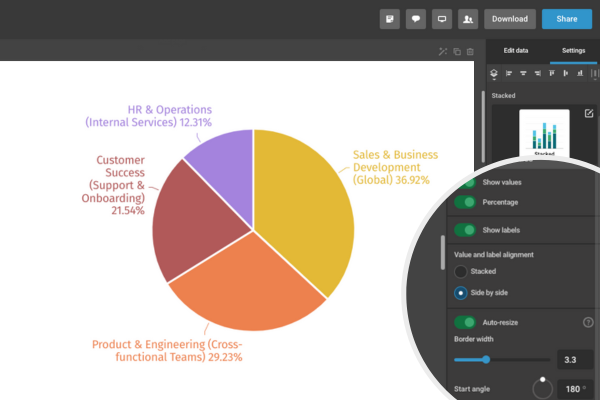
The layout will update automatically based on your choices. You can also adjust the font size, spacing, and color to match your design.
This update gives you more control over how your pie and doughnut charts look and how clearly your message comes across. Just open a new chart in Infogram, and explore the updated label settings in chart properties.
Get data visualization tips every week:
New features, special offers, and exciting news about the world of data visualization.