19.12.2016 by roberts
By Monica Powell, published on Black Tech Diva – June 7, 2016.
This post will go over how to connect with the Spotify API to collect information about artists using Python 3 and then create an infographic from the data Spotify returned.
Preview of what we will be creating… ?
Installing Requests
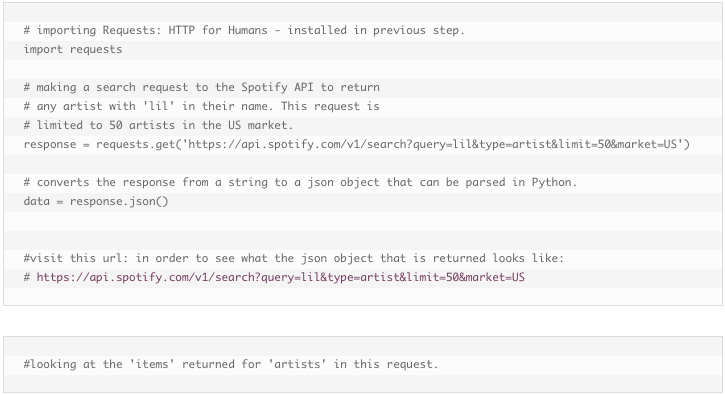
In order to play around with Spotify’s API in Python to gather data about artists, I installed Requests: HTTP for Humans via the terminal using: $ pip install requests. Note: Requests is a library that can be used to make API calls and is not limited to use only with the Spotify API.
spotify.py
Note: You can explore documentation for the Spotify web API here.
The Spotify API describes items returned from search as:
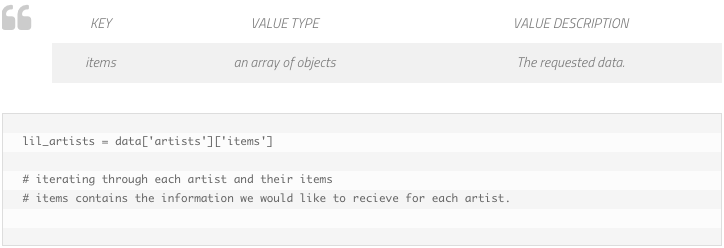
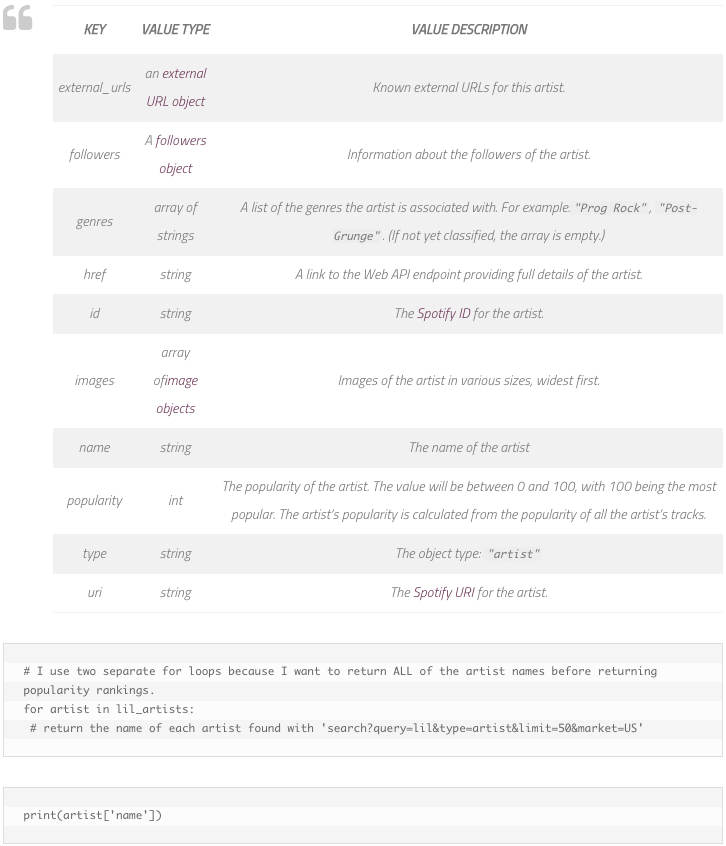
Artist object (full) (from Spotify API)
Note: Spotify’s API will also return artists that had names that formerly matched query. For example: Boosie Badazz, G Herbo and Bow Wow no longer user ‘lil’ in their stage name, however, they are included in this dataset.
Returns:
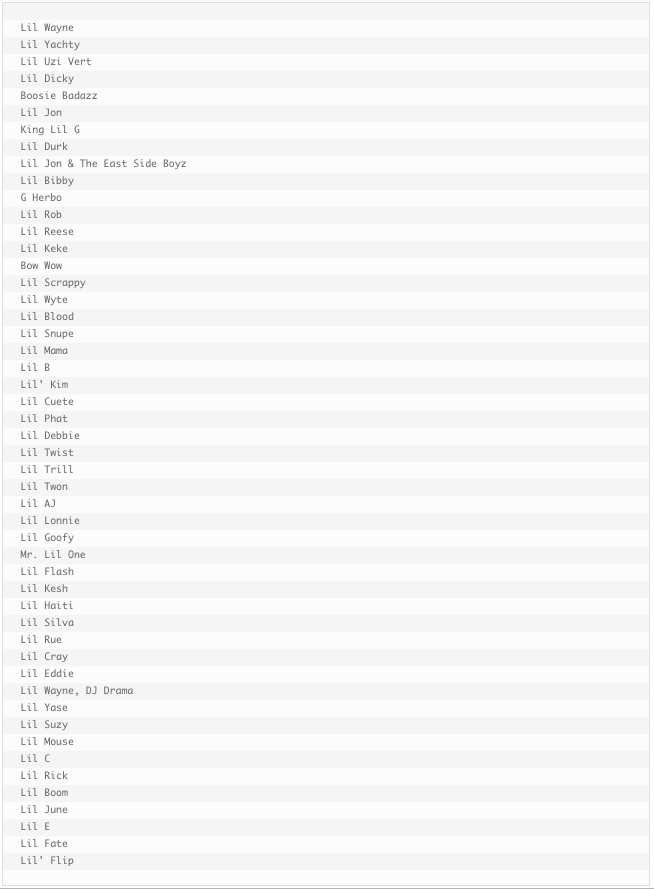

Returns:
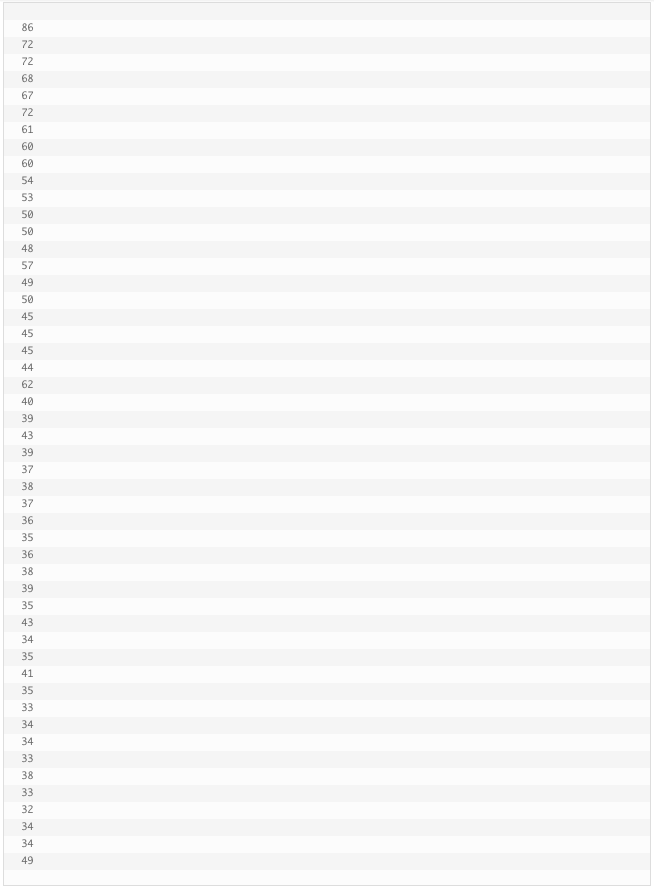
Visualize Data
1) Create a free Infogram account.
2) Select ‘Chart or Graph.’
3) Select the type of chart or graph you would like to create.
4) The chart will be filled with dummy data. Double-click on the chart to pull up the chart editor. This will allow you to manipulate the data.
5) Delete the dummy data that Infogram automatically includes.
6) Copy and paste the output of:print(artist['name']) and print(artist['popularity']).
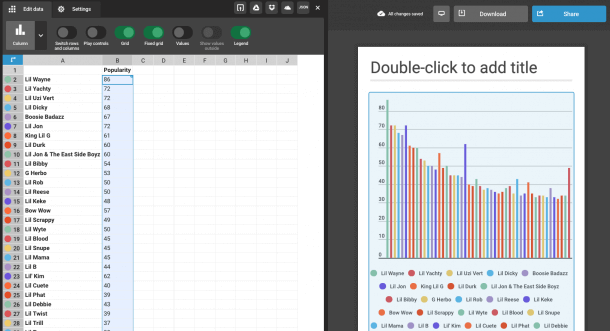
7) The result is a beautiful graphic with all of the data you pasted into Infogram. Now you can play around with the visual aesthetic of the graphic.
Infogram charts I created from this data
(FYI: set limit to 10 for this one — the other two examples have 50 data points)
 Monica Powell is a front-end web developer interested in exploring Human-Computer Interaction. In 2014, Monica started Black Tech Diva to document her journey learning more about programming and web development. If you’d like to chat, feel free to tweet her: @waterproofheart.
Get data visualization tips every week:
New features, special offers, and exciting news about the world of data visualization.