04.10.2017 by Infogram
The Infogram team has worked hard over the past few months improving classic features and installing major updates. Some you requested, and some you never knew you needed! Here are a few exciting changes we’ve made this summer:
Region names on map markers
Add region or country names to map markers. This is a great way to quickly add more information to your map or infographic, helping your viewer spot key locations in seconds. You can even change the text that appears over each marker once you’ve placed them on the map.
Copy charts between projects
Use keyboard shortcuts to copy and paste elements from one project to another. This process is simple and saves you the trouble of re-creating a chart you want to re-use. This is hugely beneficial when working from an Infogram team account.
Link multiple datasets
Switch multiple related datasets in just one click. You can now link charts to create more engaging, interactive reports and infographics. Make sure your objects have the same tab names when you enable this feature in the project settings.
Viewer data downloads
This awesome feature lets your viewers download data directly from your charts and maps. Simply turn the Download setting on under Chart Properties and you’ll see a small download button appear in the bottom left corner.
Font resizing for charts
Long awaited font resizing for charts and maps is now available under settings. Make your charts easier to read by changing the size of labels, legends, axes, and tooltips.
Add project descriptions
Add a description to your project to gain more visibility online. Summarize the content of your chart or infographic to get your publicly published work seen by more people.
Trash folder
Never lose an important project again. We’ve added a Trash folder that will store your deleted projects for 30 days until they are removed permanently. Want to salvage a project you deleted? Just visit the Trash folder and click ‘Restore.’
Spellcheck
Say goodbye to misspellings for good. You worry about the charts, we’ll make sure you always look great.
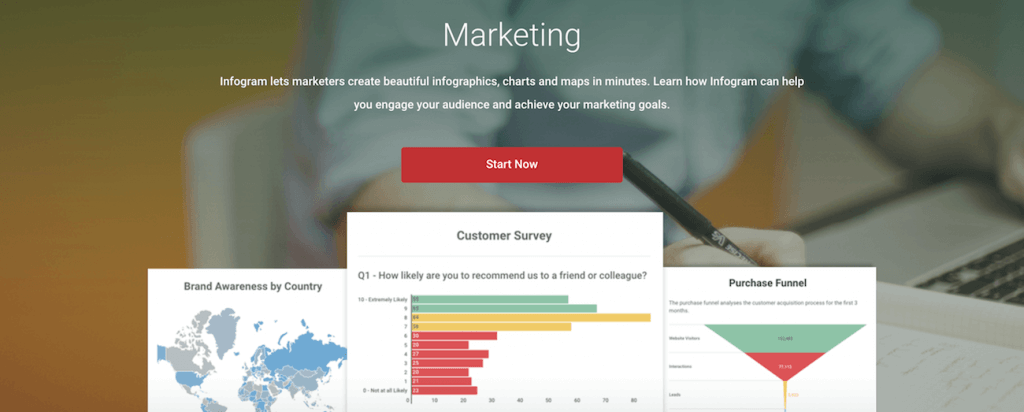
Infogram for every industry
Our updated case study pages show you how Infogram can make you stand out in your industry. It doesn’t matter if you’re in marketing, education, business, or the media; we’re here to meet all of your data visualization needs.
New team plan
We recently launched a powerful new team plan for Enterprise users. Collaborate with your coworkers and colleagues with ease. Create shared folders, enjoy custom theme templates, and measure chart analytics.
We hope you like all the newness and can’t wait to try our latest features. We’ve even expanded chart settings to give you more control over axes labels, chart gridlines, value formats and interactive tooltips.
Would you like to experience the full power of data visualization? Try Infogram for Teams or Enterprise for free! With a Team or Enterprise account, you can create up to 10,000+ projects, collaborate with your team in real time, use our engagement analytics feature, and more. Request your free demo here.
Get data visualization tips every week:
New features, special offers, and exciting news about the world of data visualization.