22.11.2023 by Infogram
Data visualizations are surprisingly common in your everyday life, but they often appear in the form of well-known charts and graphs. A combination of multiple visualizations and bits of information is often referred to as infographics.
Data visualizations can be used to discover unknown facts and trends. You may see visualizations in the form of line charts to display change over time. Bar and column charts are useful when observing relationships and making comparisons. Pie charts are a great way to show parts of a whole. And maps are the best way to visually share geographical data.
What makes a good data visualization?
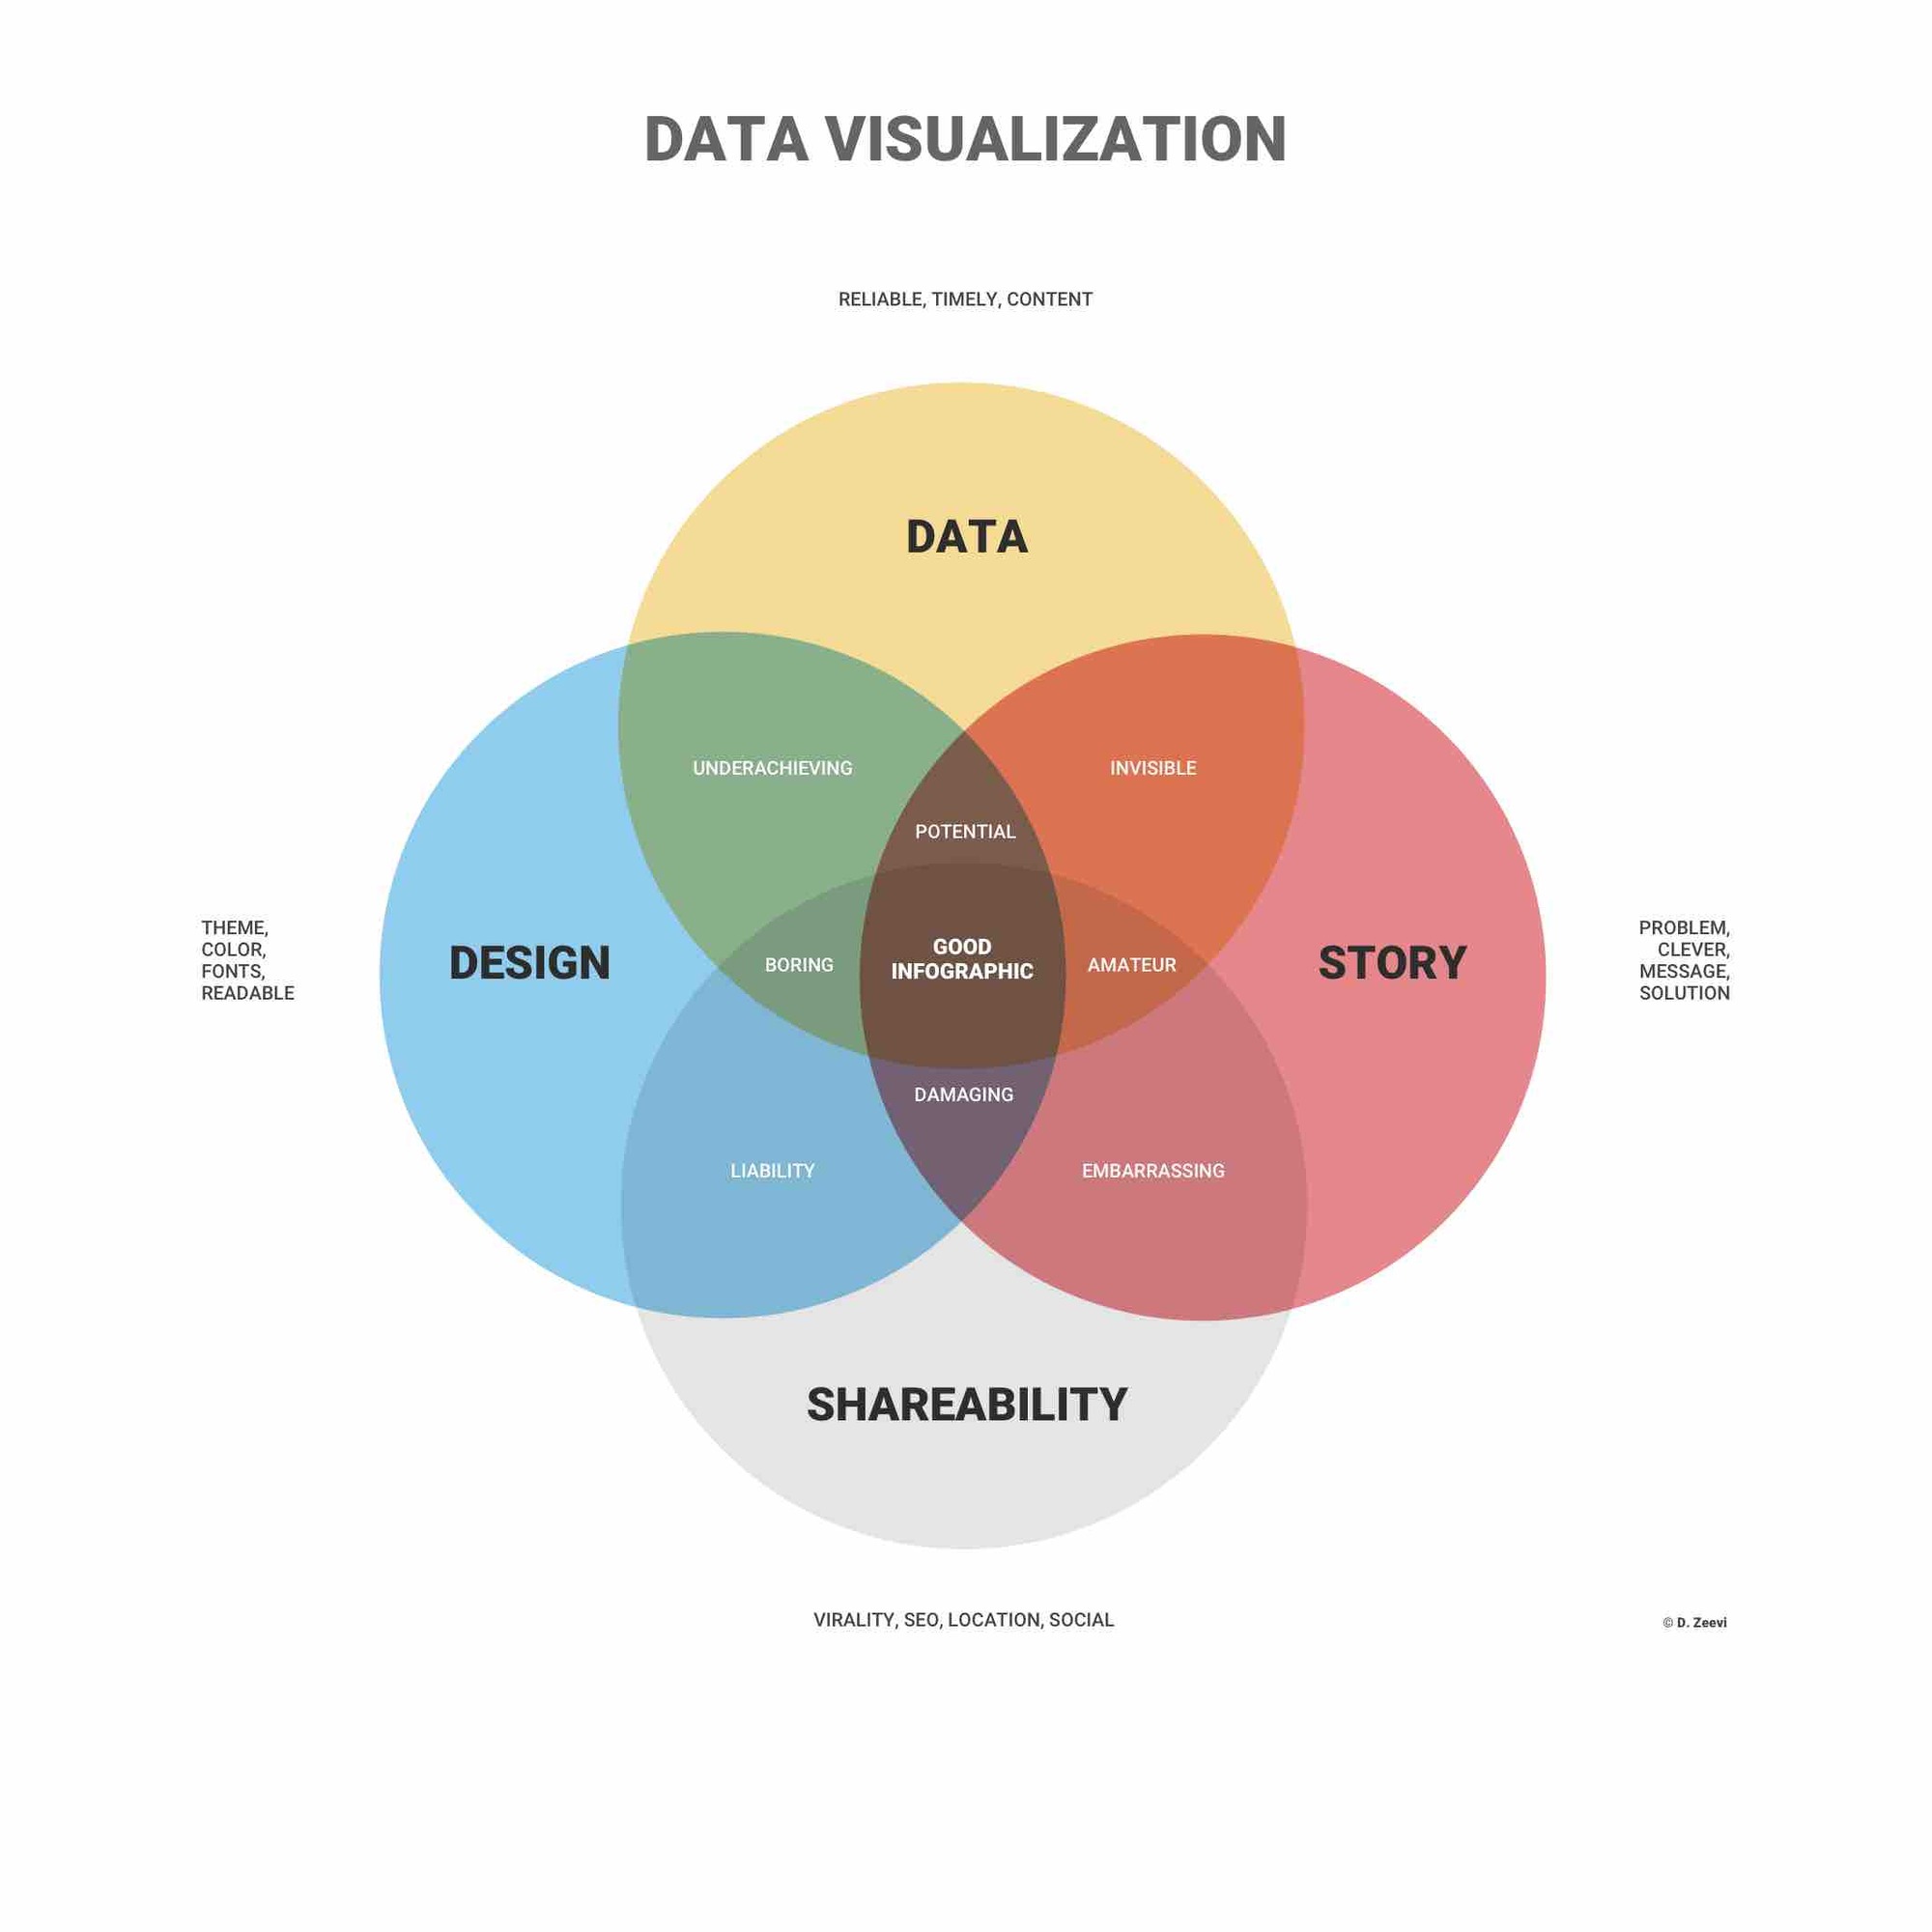
Good data visualizations are created when communication, data science, and design collide. Data visualizations done right offer key insights into complicated datasets in ways that are meaningful and intuitive. American statistician and Yale professor Edward Tufte believes excellent data visualizations consist of ‘complex ideas communicated with clarity, precision, and efficiency.’
In order to craft a good data visualization, you need to start with clean data that is well-sourced and complete. Once your data is ready to visualize, you need to pick the right chart. This can be tricky, but there are many resources available to help you choose the right type of chart for your data.
After you have decided which chart type is best, you need to design and customize your visualization to your liking. Remember, simplicity is key – you don’t want to add any elements that distract from the data. Now that your visualization is complete, it’s time to publish and share it with your colleagues, customers, or readers.
Why does data visualization matter?
Better decision making
Today more than ever, organizations are using data visualizations, and data tools, to ask better questions and make better decisions. Emerging computer technologies and new user-friendly software programs have made it easy to learn more about your company and make better data-driven business decisions.
The strong emphasis on performance metrics, data dashboards, and Key Performance Indicators (KPIs) shows the importance of measuring and monitoring company data. Common quantitative information measured by businesses includes units or products sold, revenue by quarter, department expenses, employee stats, and company market share.
Meaningful storytelling
Data visualizations and information graphics (infographics) have become essential tools for today’s mainstream media.
Data journalism is on the rise and journalists consistently rely on quality visualization tools to help them tell stories about the world around us. Many well-respected institutions have fully embraced data-driven news including The New York Times, The Guardian, The Washington Post, Scientific American, CNN, Bloomberg, The Huffington Post, and The Economist.
Marketers also benefit greatly from the combination of quality data and emotional storytelling. Good marketers make data-driven decisions on a daily basis, but sharing with their customers requires a different approach – one that touches both intelligently and emotionally. Data visualizations help marketers share their message using statistics and heart.
Learn how to use data storytelling best practices to o create stunning images and powerful presentations.
Stanford University Professor of Marketing Jennifer L. Aaker said:
“When data and stories are used together, they resonate with audiences on both an intellectual and emotional level.”
Data literacy
Being able to understand and read data visualizations has become a necessary requirement for the 21st century. Because data visualization tools and resources have become readily available, more and more non-technical professionals are expected to be able to gather insights from data.
Increasing data literacy around the world has been one of the main pillars of Infogram’s mission from day one. We truly believe in the importance of data education and support around the world.
Infogram CEO Mikko Jarvenpaa explains:
“We believe that better-informed people make better decisions, and people who can both read and create data-driven communications are central to this.”
The history of data visualization
Data visualization has been around for centuries, and many would agree it began in the late 1700’s with William Playfair – better known as the ‘father of statistical graphics.’ Playfair is credited with having invented the line, bar, and pie chart we use so often today.
Florence Nightingale is famous for her work as a nurse during the Crimean War, but she was also a data journalist, known for her ‘coxcomb’ or ‘rose’ diagrams. These revolutionary charts helped her fight for better hospital conditions, ultimately saving soldier’s lives.
One of the most well-known historical data visualizations comes from Charles Joseph Minard. Minard was a French civil engineer famous for his representation of numerical data on maps. His most famous work is the map of Napoleon’s Russian campaign of 1812 displaying the dramatic loss of his army over the advance on Moscow and the following retreat.

Why use data visualization?
- Make data easier to understand and remember
- Discover unknown facts, outliers, and trends
- Visualize relationships and patterns quickly
- Ask better questions and make better decisions
Useful links about data visualization
Data Visualization Video Workshop
Interested in discovering how Infogram can enhance your team’s work? Join a brief Zoom session with our Infogram representative to explore key features, get answers to your questions, and understand how we can assist. It’s quick, informative, and just like a coffee-break chat. Schedule your call now!
Get data visualization tips every week:
New features, special offers, and exciting news about the world of data visualization.