29.12.2015 by Infogram
1) Killer Whales (Hiram Henriquez)
This infographic posted by Visualoop is fantastic because it brings awareness to an important environmental issue in a beautiful, data-driven way. It features a wide variety of data visualizations, which we love here at Infogram – making it one of the best infographics of 2015.

2) The Psychology of Logo Color (Inc.)
Have you ever thought about how important a company’s logo is? Size, shape, font, and other design-related details are factors in a great brand design, but color is critical. This infographic explains how a brand’s logo color can influence its consumer’s overall perception. It is visually stunning, detailed, and well organized.

3) A World of Languages (South China Morning Post)
According to this infographic, there are 7.2 billion people on the Earth, speaking at least 7,102 known languages. This fascinating graphic compares the number of people that speak the top 23 languages in the world as their primary language. It does a good job of displaying a complicated data set in a way that is easy to understand and fun to enjoy.

4) World’s Deadliest Animals (Bill Gates Blog)
What would you say is the most dangerous animal on Earth? Sharks? Snakes? Humans? This straight-forward infographic shows the breakdown of how many people are killed by animals per year. The answer will surprise you – it’s mosquitos!
![]()
5) The Greatest Storytellers (Raconteur)
When you think storytelling you may not think numbers. Well, think again! This infographic does a great job of highlighting history’s best authors, poets, and playwrights – based on a survey of 500 authors, journalists, professionals and students. Its design is easy to follow and very thorough, covering ancient times to present day.

6) Dear Data (Giorgia Lupi and Stefanie Posavec)
When you think about it, life is one big data set. This data visualization project by Giorgia Lupi and Stefanie Posavec won the hearts of the dataviz community and beyond in 2015. Each week the two information designers sent each other hand-drawn infographics filled with the ‘small data’ of their lives. It took first place at this year’s Information is Beautiful Awards.

7) Men’s Dress Codes (Samuel Windsor)
This visual guide shows men the proper way to dress for various occasions. It takes a few menswear traditions and explains them in 5 classy panels. We love its slick illustrations and interesting tips. Now men can dress confidently for any function!

8) Cost of Living Around the World (Movehub)
Have you ever wondered how expensive it would be to live in Brazil? Russia? Japan? This infographic compares the cost of living in various countries around the globe, taking into account groceries, transportation, restaurants, and utilities. It’s simple, with a mature color palette and little copy – so its great for visual learners.

9) Dinner Tables Around the World (Wimdu)
Different cultures have different traditions, which can be important when visiting a new place. This playful Infographic explains curious customs from dinner tables around the world! Just remember to eat asparagus with your fingers in Britain, keep your hands on the table in France, and smash your potatoes with a fork in Germany.

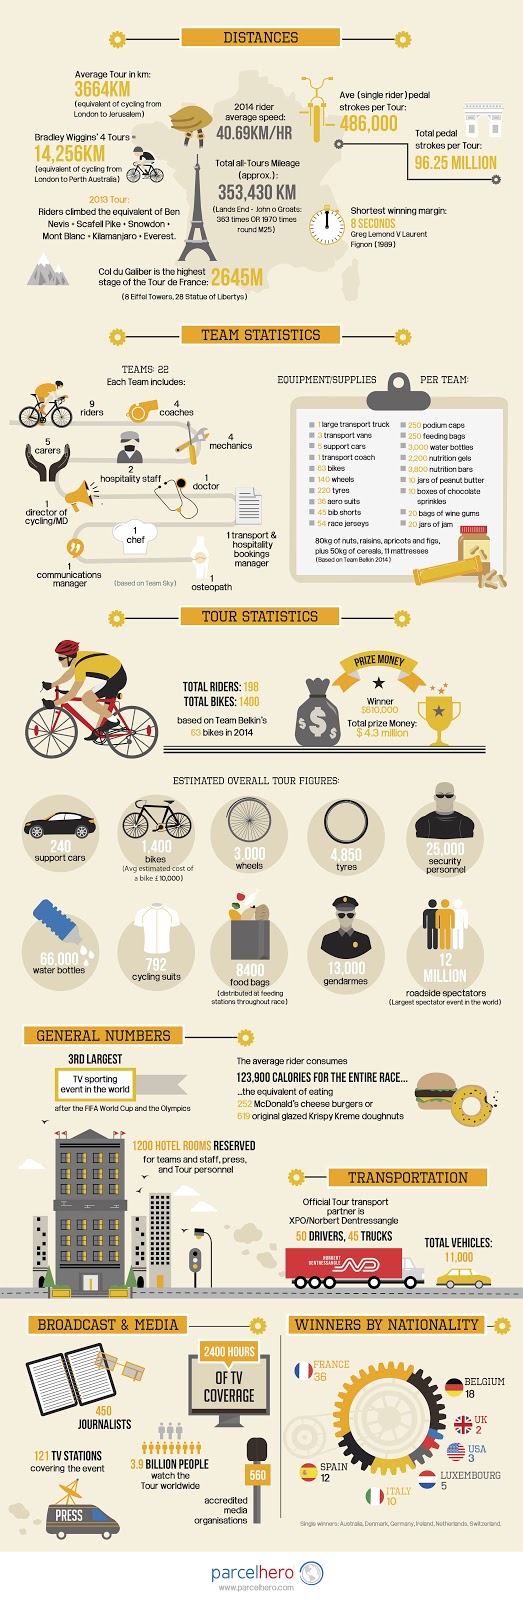
10) Le Tour De France 2015 (Tour De France)
Here is an infographic containing all the facts and stats for this year’s Le Tour De France – explained in great detail with fun images. It lets you know how far team members ride, how much they eat, who covers the race, and who has won in the past. It’s nice to have such a complex event broken down in a well-balanced, interesting way.
11) Social Network Cheat Sheet (Adweek)
Social media can be a time consuming, labor intensive process for some companies. This informative cheat sheet teaches brands the specific dimensions and stylings of Twitter, Facebook, Google+, Pinterest, Snapchat, Vine, Foursquare, Instagram, Tumblr, YouTube, LinkedIn and Vimeo – all in one graphic, no google search required.

Get data visualization tips every week:
New features, special offers, and exciting news about the world of data visualization.