17.11.2016 by Infogram
Would you like to know how other marketers are using social media and plan to use it in 2017? Lucky for you, Buffer just released its State of Social 2016 report, helping you navigate what’s coming next in the world of social media.
Buffer surveyed over 1,200 marketers from businesses of all sizes and put together this handy social media guide. We’ve selected a few highlights from this year’s report.
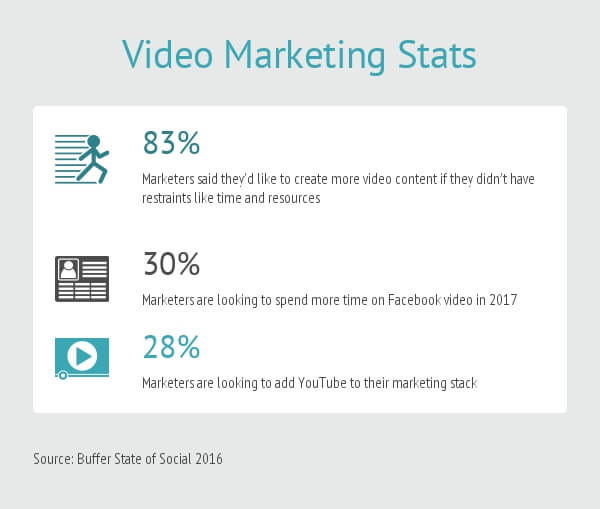
Marketers want to make more video, but feel like they can’t
Despite a recent report that Facebook exaggerated its video metrics, online video is hitting peak popularity. Marketers want to create more video content, but feel restrained by obstacles like time, resources, and budget.
Regardless of these issues, video content is hot and makes your Facebook feed stand out. You need to start creating effective video content soon before the landscape gets too saturated or you are required to pay for video reach.
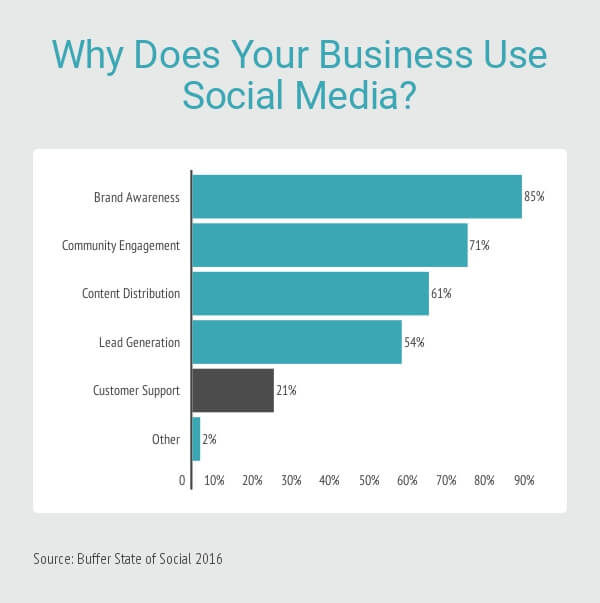
Most people don’t take advantage of social for customer support
When Buffer asked businesses why they use social media, most people answered brand awareness, followed by community engagement and content distribution. Only 21% of businesses listed customer support as a reason they use social.
This is a huge missed opportunity! Many people use social media as a place to reach out to businesses and voice their concerns. If you don’t already, 2017 might be a great time to offer more support on social media – your customers will appreciate it.
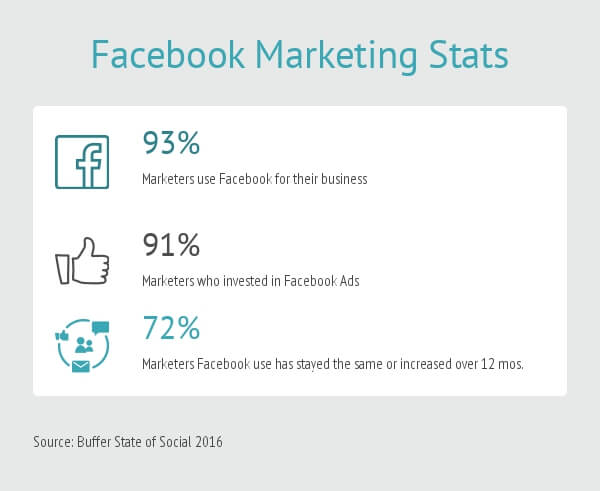
Facebook is still king, so it’s time to figure it out
Facebook is still the leading platform for marketers. When asked which platform businesses currently use, Facebook was the clear winner, followed by Twitter, LinkedIn, and Instagram. If you have a bit of a budget to work with, now is the time to invest in Facebook Ads and experiment with Facebook video.
Buffer encourages you to continue the conversation on Twitter, using #StateofSocial16.
Do you want to make charts like the ones featured in this article? Visit Infogram to explore our beautiful pre-designed templates, large selection of chart types and maps, and easy-to-use infographic editor.
Get data visualization tips every week:
New features, special offers, and exciting news about the world of data visualization.