14.07.2016 by Infogram
When you’re looking for a job, it can be hard to stand out from the crowd. Given the fact that we live in a visually driven society, it isn’t surprising that some people are turning their resumes into eye-catching infographics.
That being said, adding data and visuals to your resume takes skill. The last thing you want to do is turn off your future employer and send your resume straight to the ‘no’ pile. This is why we have put together a few tips on how to build the perfect infographic resume:
Clean and Simple
Keep it clean, simple, and sharp. You only have a few seconds to get your point across. Make sure you highlight your achievements, not distract from your accomplishments. Be thoughtful when choosing which colors, fonts, and charts you want to use. Don’t make a recruiter work hard trying to understand your resume. And remember, your infographic needs to relate directly to the job you are applying for.

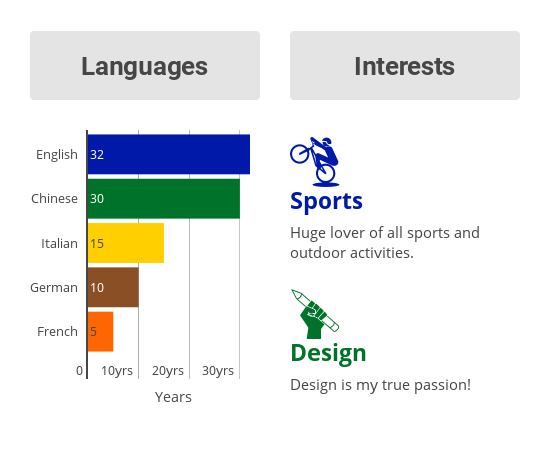
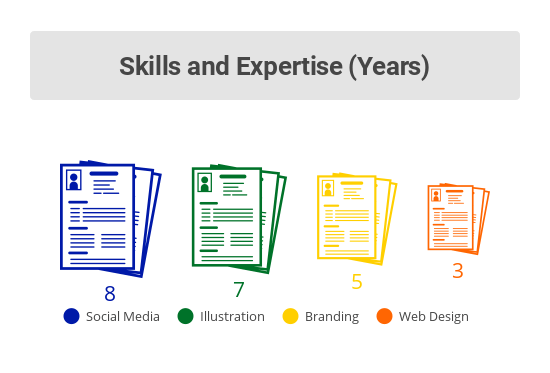
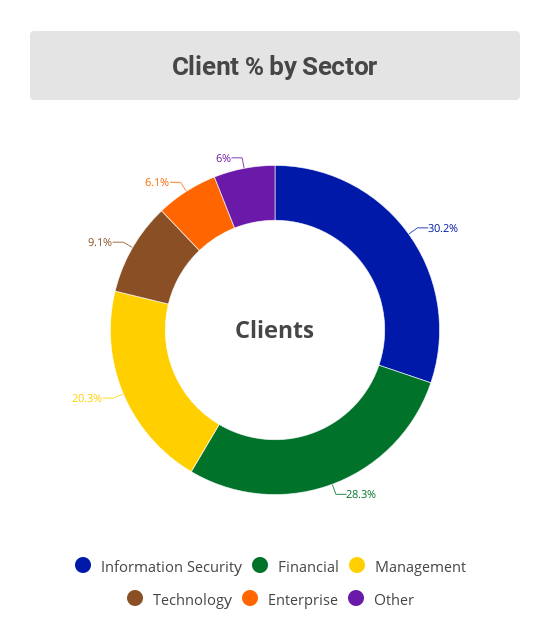
Data Suggestions: You have a lot of options when it comes to visualizing data for your infographic resume. You can share your past work experience, skills, languages you speak, education, social media followers, and interests.
Use Data Visualization Best Practices
Don’t forget design and best charting practices. A poorly designed infographic resume can quickly disqualify you from the job you want. Use the right chart types for the data you want to share about yourself. Use bar or column charts for displaying skills expertise, for example. But, don’t use a line or area chart for this because chances are your skills aren’t changing over time.
If you want tips on how to pick the right chart and make it look great, download our free eBook – ‘The Ultimate Data Visualization Guide: Chart Do’s and Don’ts.’
Be Clever and Show Your Strengths
Infographics engage the viewer, so use this to your advantage. Tying your resume into the role and business you are applying for is smart. Include charts and information that clearly show your past success and passion for the company and role you’re applying for.
Visualize metrics that display growth! Show your future employer how you increased revenue, added new accounts, and reached more people.

Warning: If you don’t have an impressive job history, a visual representation of your past experience will only highlight that fact. You don’t want your future employer to think you made an infographic resume to distract them during the hiring process, hiding the fact that you aren’t as qualified as you need to be.
Know Your Audience
Infographic resumes don’t work for every job and every industry. Think about who is going to see your resume. Some employers view infographic resumes as unprofessional, so prove that you take the job hunt seriously.
Highlight Results, Not Responsibilities
Now that you’ve got their attention, show them your worth. Infographics help people absorb and retain data quickly. They are the perfect way to show off your results, putting them front and center. Potential employers won’t need to search through blocks and bullet points of text to find out if you are the right person for the job.

Keep a Traditional Resume on Hand
Many recruiters still rely on traditional resumes, so make sure you also have a standard resume on hand. While infographic resumes show your creative capabilities, they are more like an extra tool in your toolkit.
If you are applying for a creative job, we suggest you include graphic samples, portfolios, and an infographic resume along with the standard form. Not having a traditional resume on hand may make you look unprofessional or unprepared, so always have one with you in case it is required.
Include a Call-to-Action
What do you want the reader to do after they view your resume? If you want the reader to contact you, include a ‘contact me’ call to action. If you want people to contact you on specific social media channels, or navigate to your blog or website, tell them!
Infogram is here to help you land your dream job and stand out from the masses. We have a large selection of beautiful, professional templates for you to choose from. Plus, building an infographic with Infogram is super easy!
Get data visualization tips every week:
New features, special offers, and exciting news about the world of data visualization.

