06.12.2023 by Infogram
We’re thrilled to announce a new feature that improves the customization of your data visualizations: the ability to adjust the opacity of chart colors. This update brings an added layer of sophistication to your charts, allowing for more nuanced and visually appealing presentations.
How does it benefit you?
With this new feature, your data visualizations can now achieve a perfect balance between aesthetic appeal and informational clarity. The ability to modify color opacity enables you to:
- Enhance readability. Adjusting opacity can help reduce clutter and focus attention on key data points.
- Improve visual layering. Create depth in your charts, making complex data easier to understand.
- Customize for branding. Align charts more closely with your brand or project’s visual guidelines.
- Increase engagement. More visually appealing charts are likely to keep your audience engaged for longer.
What can you achieve with it?
- Convey complex stories through data with charts that are both informative and visually compelling. Use opacity to highlight the most crucial elements of your story, making your reporting clearer and more impactful.
- Stand out on social media and in your content with charts that pop. Tailor opacity to align with your unique style and thematic content, making your data presentations as creative as your ideas.
- Present data in a way that is not only accurate but also accessible. Adjusting the opacity can help distinguish between different data layers, making your analyses easier to interpret for a non-technical audience.
- Communicate the impact of your work with clear, engaging visuals. Use opacity settings to emphasize key data points, making your reports more persuasive to donors and stakeholders.
- Elevate your marketing materials with sleek, branded charts. Customize opacity to match your company’s branding, making your interactive data visualizations an integral part of your marketing strategy.
How to?
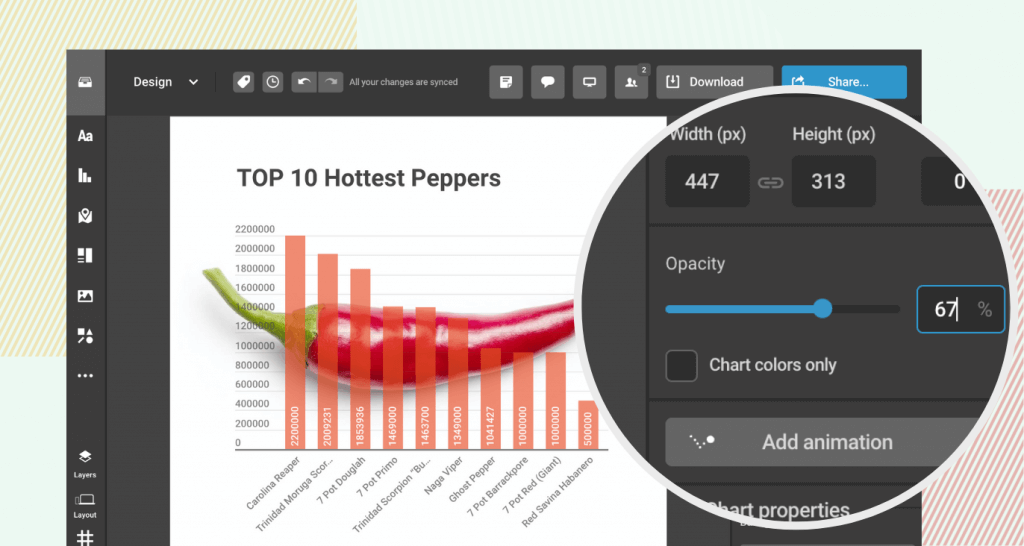
For a step-by-step guide on how to modify the opacity of chart colors, please read our instructional article.
Get data visualization tips every week:
New features, special offers, and exciting news about the world of data visualization.