03.10.2023 by Infogram
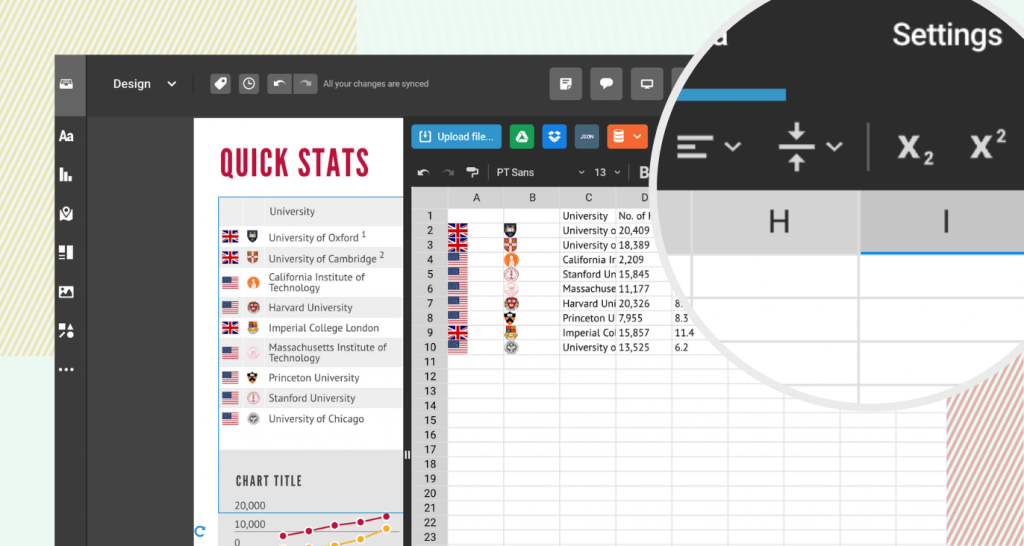
We’re excited to reveal the newest feature in Infogram’s arsenal: superscript and subscript for table charts!
The integration of superscript and subscript goes beyond mere aesthetics; it’s purpose-driven. You can now indicate footnotes, highlight chemical formulas, or signify mathematical terms without the need for complicated explanations or brackets. This means your visualizations stay clutter-free and sleek.
Why does this matter?
- Sophisticated design: The superscript and subscript options infuse your charts with a professional touch, transforming basic charts into engaging and intuitive visual displays.
- Crystal clear data: Say goodbye to distractions. These tools ensure that the viewer’s attention remains focused on the most important data.
- Versatility: Be it a scientific exploration, a glance at financial trends, or a deep dive into market insights, these formatting features will make your charts stand out in every setting.
Where can you use this feature?
- Reports: Seamlessly annotate key insights or references in your data, preserving the rhythm of your narrative.
- Infographics: Underline crucial data points or provide clear explanations directly in your graphics. Let the story flow without interruption.
- Maps: For geographical data representation, use these features to indicate specific locations, altitude data, or sources seamlessly.
- Slides: Enhance your presentations by including accurate and organized data tables. Your message will be easily understood by any audience.
- Dashboards: Whether it’s a KPI tracker or a performance monitor, embed superscripts and subscripts to ensure concise, yet comprehensive data labeling. Every metric gets the clarity it deserves.
- Posters: Organizing an event or showcasing results? Use superscripts for footnotes or subscripts for additional details, ensuring the main message remains prominent.
Need a quick tutorial? Here’s how to get started:
- Open your table chart on Infogram.
- Highlight the text that you want to improve.
- On the formatting toolbar, select either the superscript or subscript icon.
- And there you have it – a transformed piece of text!
Get data visualization tips every week:
New features, special offers, and exciting news about the world of data visualization.