26.11.2024 by Infogram
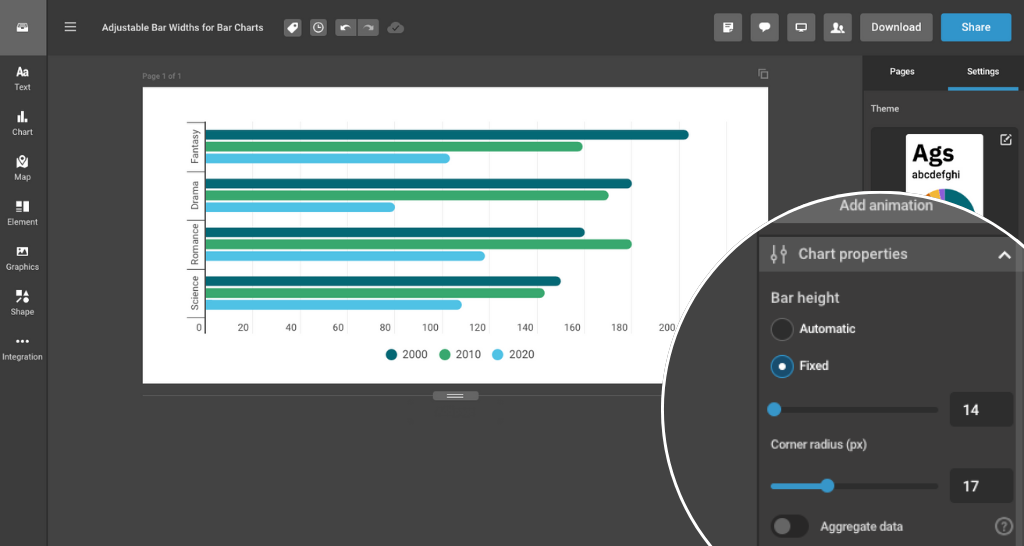
At Infogram, we are constantly improving our tools to help you create clear and effective data visualizations. Our latest update introduces the ability to adjust the bar widths in bar charts, giving you more control over how you present your data. This feature is now available for bar charts, stacked bar charts, and stacked percent bar charts, making it easier to customize your visualizations to meet your specific needs.
Many users face challenges when creating bar charts, particularly when trying to make charts more readable or fit within a specific layout. The adjustable bar width feature solves these problems by allowing you to modify the width of the bars in your charts, helping to ensure that your data is presented clearly and effectively. This added flexibility makes it easier to avoid overcrowded charts and ensures your visuals are well-spaced and easy to interpret.
Practical use cases
Here’s how adjustable bar widths can help different users:
- For analysts. When preparing a quarterly report, analysts can adjust the bar widths in a stacked bar chart to make data points more distinguishable. This customization helps prevent clutter, making it easier to identify trends and key metrics.
- For marketing managers. When creating a grouped bar chart to track campaign performance across different regions, marketers can adjust the bar width to better fit the data, making comparisons clearer for stakeholders.
- For content writers. Writers who need to present performance metrics in a bar chart within a report can adjust the bar widths to make the data more visually appealing and easier to follow, enhancing readability for the audience.
- For designers. Designers preparing assets for their team can fine-tune the appearance of grouped bar charts, adjusting the spacing between bars to create a polished, balanced, and more visually engaging layout.
Benefits of adjustable bar widths
The ability to adjust the bar widths provides greater control over how your data is presented. It ensures that your charts are not only more readable but also more visually appealing. Whether you’re working with bar charts, stacked bar charts, or stacked percent bar charts, this feature allows you to fine-tune the layout to fit your design requirements.
In addition, this update addresses the previous limitations of visual consistency across different project types, offering a smoother, more uniform experience for both flex and responsive projects.

Log in to your Infogram account today and start using the adjustable bar width feature. For more information on how to customize your charts, visit our help center or explore the feature guide. Create more effective, personalized charts that clearly communicate your data.
Get data visualization tips every week:
New features, special offers, and exciting news about the world of data visualization.