09.07.2024 by Infogram
Data visualization has long been the champion of transforming complex information into clear, understandable visuals. While user-friendly data visualization tools have democratized data viz creation, other difficulties remain. Choosing the right chart type, improving visual appeal, and meeting tight deadlines can still pose a challenge. This is where Artificial Intelligence (AI) steps in, enriching data visualization tools with AI-powered features that streamline workflows, help in decision-making, and automate data processes.
Ultimately, AI data visualization tools help in scaling and improving your data visualization creation process. However, with more AI data visualization tools becoming available, how can you decide on the best option for your data needs? In this article, we’re going to list the top 5 AI visualization tools. We’re going to highlight their key features to help you decide on the best option for your data. Also, we’ll explore noteworthy benefits of AI for data visualization and considerations to keep in mind.

How is AI transforming data visualization?
With the introduction of AI in the data visualization field, more possibilities to create, share, and analyze data have become available. Here are some of the ways AI is scaling data visualization:
- Automated chart recommendation: AI can analyze your data and suggest the most appropriate chart type to effectively represent the story within.
- Smart data discovery: AI can reveal hidden patterns and relationships within your data, prompting further exploration and visualization of these insights.
- Real-time visualization: AI can handle dynamic data streams, enabling interactive visualizations that update in real-time.
- Automated data cleaning and augmentation: AI can pre-process your data, cleaning inconsistencies and even enriching it with additional relevant information for an improved visualization.
What makes a great AI data visualization tool?
With a growing number of AI-powered data visualization tools, choosing the right one becomes more challenging. Here are some key features to consider:
- Ease of use: Even with AI assistance, the tool should be intuitive and user-friendly, allowing you to focus on the insights, not the platform mechanics. For example, an intuitive drag-and-drop interface should make adding data, configuring charts, and arranging elements a simple process.
- Data source integration: Easy integration with your existing data sources is essential for a smooth workflow. Also, security is key, so the tool should have reliable measures in place to protect your data throughout the visualization process.
- Customization options: The AI should offer a variety of chart types to best represent your data and the story you want to tell. However, you should still have the power to customize charts and layouts to match your specific needs and branding.
- Collaboration features: The ability to share and collaborate on visualizations with colleagues is a valuable feature in any data visualization tool.
Top 5 AI data visualization tools
While there are many AI data visualization tools available, we’ve listed the top data visualization tools. These tools come with versatile set of features. By taking a closer look at each of them, you’ll be able to select the best option for your data needs and preferences. Here are the top AI data visualization tools:
Infogram
Infogram is a powerful AI data visualization tool that’s designed for anyone to create clear and engaging visuals, no matter the skill set. It specifically stands out with interactivity features and AI-powered functionalities. With Infogram, you can benefit from animations and hover effects, making your charts interactive and visually appealing. Also, Infogram’s map tool lets you create interactive maps with tooltips, clickable legends, and zooming for in-depth data exploration.
And Infogram goes a step further with its AI features, helping you transform data into impactful visuals. A noteworthy feature to highlight is Infogram’s AI chart suggestions that take the guesswork out of choosing the right chart type for your data. Furthermore, Infogram’s AI infographic generator and AI text editing feature help streamline workflow and inspire with useful ideas and suggestions to make your data visualizations more engaging and captivating.
Tableau
Tableau offers a user-friendly platform as an AI data visualization tool. It’s designed for people with different technical backgrounds, making it easier to transform raw data into visuals.
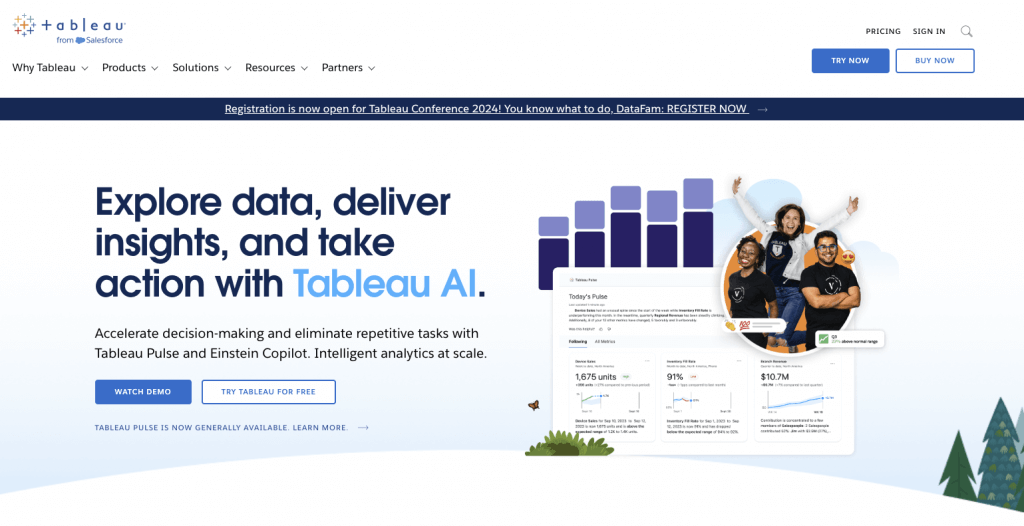
Tableau AI is a collection of tools that uses artificial intelligence to simplify data analysis for everyone in a company, regardless of their expertise. It uses a specific type of AI called generative AI to automatically analyze data and uncover insights. This is useful for both data analysts and business users to gain a deeper understanding of data quickly and securely.
Overall, Tableau’s focus on user-friendliness and AI makes it a great tool for democratized data access. It’s also great for gaining actionable insights, and driving good business outcomes.
ThoughtSpot
ThoughtSpot is an AI data visualization tool that offers an AI-powered business intelligence platform that improves data exploration. It simplifies the process by enabling users to ask questions about their data using natural language, eliminating the need for complex queries or specialized training.
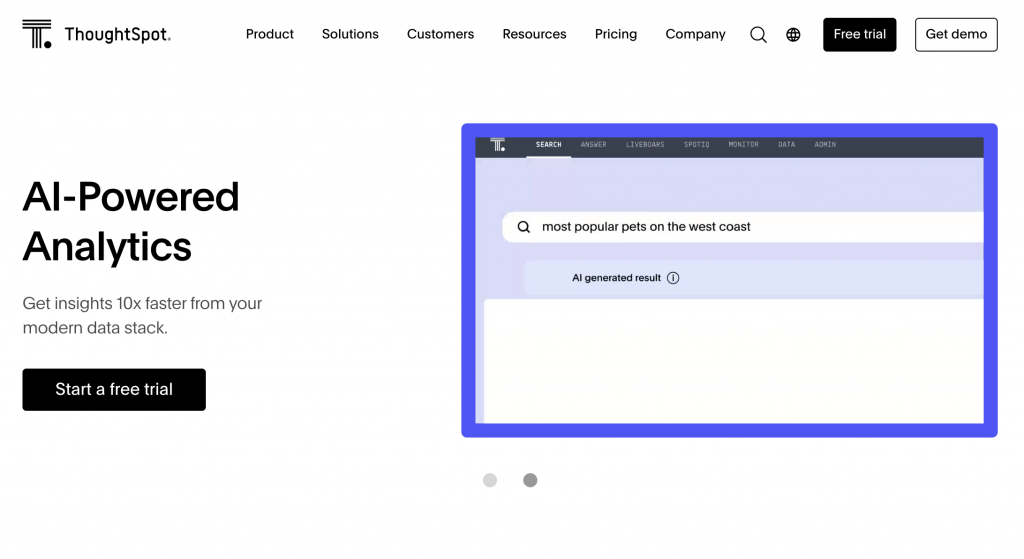
ThoughtSpot’s AI engine goes a step further than simply answering questions. It analyzes the data to uncover hidden patterns and trends that might be missed with traditional methods. Additionally, ThoughtSpot tailors its visualizations and explanations to each user’s background. This allows for clear understanding for both data analysts and non-technical users. This approach democratizes data exploration.
Looker
Looker Studio, formerly known as Google Data Studio, is a cloud-based data visualization tool. It’s designed for users of all technical backgrounds to create informative and interactive dashboards and reports. It leverages the power of Google Cloud Platform to provide a secure and scalable environment for data exploration and communication.
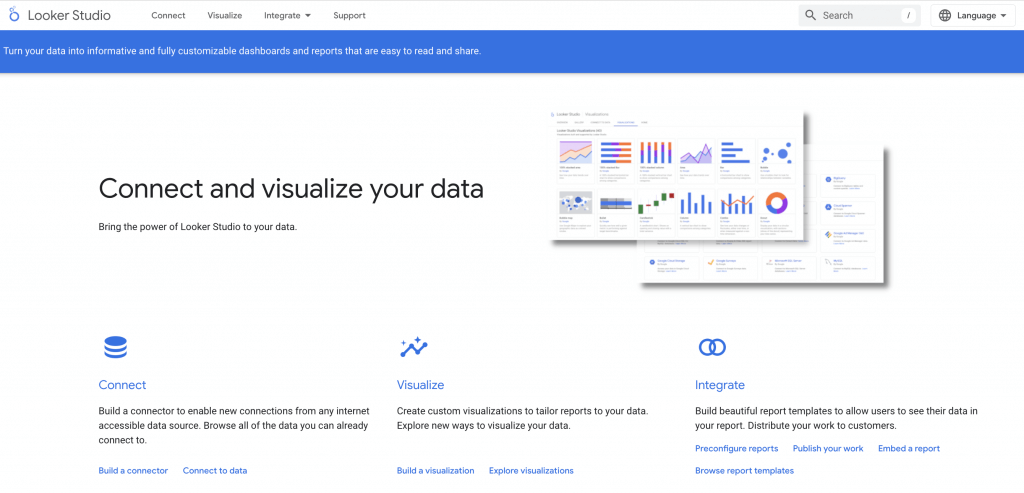
Looker Studio uses AI to suggest relevant charts and data sources based on your project. Additionally, it connects with other Google AI tools like Looker ML (a separate product) to uncover patterns and trends within your data through features like anomaly detection and forecasting.
Domo
Domo is a cloud-based business intelligence (BI) platform. It’s an AI data visualization tool, but it also offers different features for data exploration and analysis. Domo easily connects to various data sources and has a user-friendly interface.

The platform’s AI analyzes data to recommend optimal chart types, assists in creating data stories. Most importantly, Domo’s AI proactively monitors data, sending alerts and recommending actions for data-driven decision-making across the organization.
Infogram: Your go-to AI data visualization tool
While several AI data visualization tools are making waves, Infogram stands out as a truly comprehensive and user-friendly solution. Infogram seamlessly integrates the power of AI with an intuitive interface, making data visualization accessible to all.
Why Infogram?
Infogram’s strength lies in bringing your data to life with engaging interactivity. Imagine charts that update dynamically, maps that zoom in for granular detail, or infographics that respond to user actions. It empowers you to create these experiences with ease, creating deeper engagement with your information.
But Infogram doesn’t stop at interactivity. It understands the challenges of transforming data into impactful visuals. That’s where AI comes in with the following features:
- AI-powered chart recommendations: Infogram’s AI chart suggester feature analyzes your data and suggests the most effective chart type to showcase your information clearly. There’s no need to spend time picking out the best chart type or always going for the same option – let AI be your guide and surprise yourself with stunning visualizations.
- AI infographic generator: Struggling with a blank canvas? Infogram’s AI infographic generator can jumpstart your creativity by populating AI-powered templates with your data or topic of choice, saving you time and effort. This makes creating powerful infographics a much easier process.
- AI text editing: Want to quickly shorten your text or expand your idea? Infogram’s AI can summarize key points or expand on underdeveloped sections, ensuring your data visualization project delivers a clear and concise message for your target audience.
The combination of interactivity and AI features makes Infogram ideal for anyone who wants to create visualizations that inform, persuade, and inspire.
Additional features that make Infogram a powerful tool
- Drag-and-drop: Infogram’s intuitive interface allows you to create stunning visualizations with ease, even for beginners.
- Extensive data source integration: Connect to your favorite data sources like Google Sheets, Excel, and social media platforms for a streamlined workflow.
- Unmatched customization: Infogram empowers you to personalize your visualizations with your brand colors, fonts, and layouts.
- Seamless collaboration: Share your visualizations and collaborate with colleagues in real-time for better decision-making.
Ultimately, Infogram can empower you to explore hidden stories within your data and present them with clarity and impact.
AI data visualization tools: Final considerations
AI tools for data visualization are starting to open doors to deeper insights and more impactful communication. However, selecting the ideal AI data visualization tool requires careful consideration of your project and data needs. Team expertise, data complexity, and budget all play a crucial role in making the best choice. That said, take advantage of trial periods and demos offered by the AI data visualization tools to see if the tool aligns with your workflow. Remember, the power lies in actualizing the narrative potential within your data. Infogram, with its intuitive interface and AI features, empowers you to transform data into impactful insights. Try it today!
Get data visualization tips every week:
New features, special offers, and exciting news about the world of data visualization.