
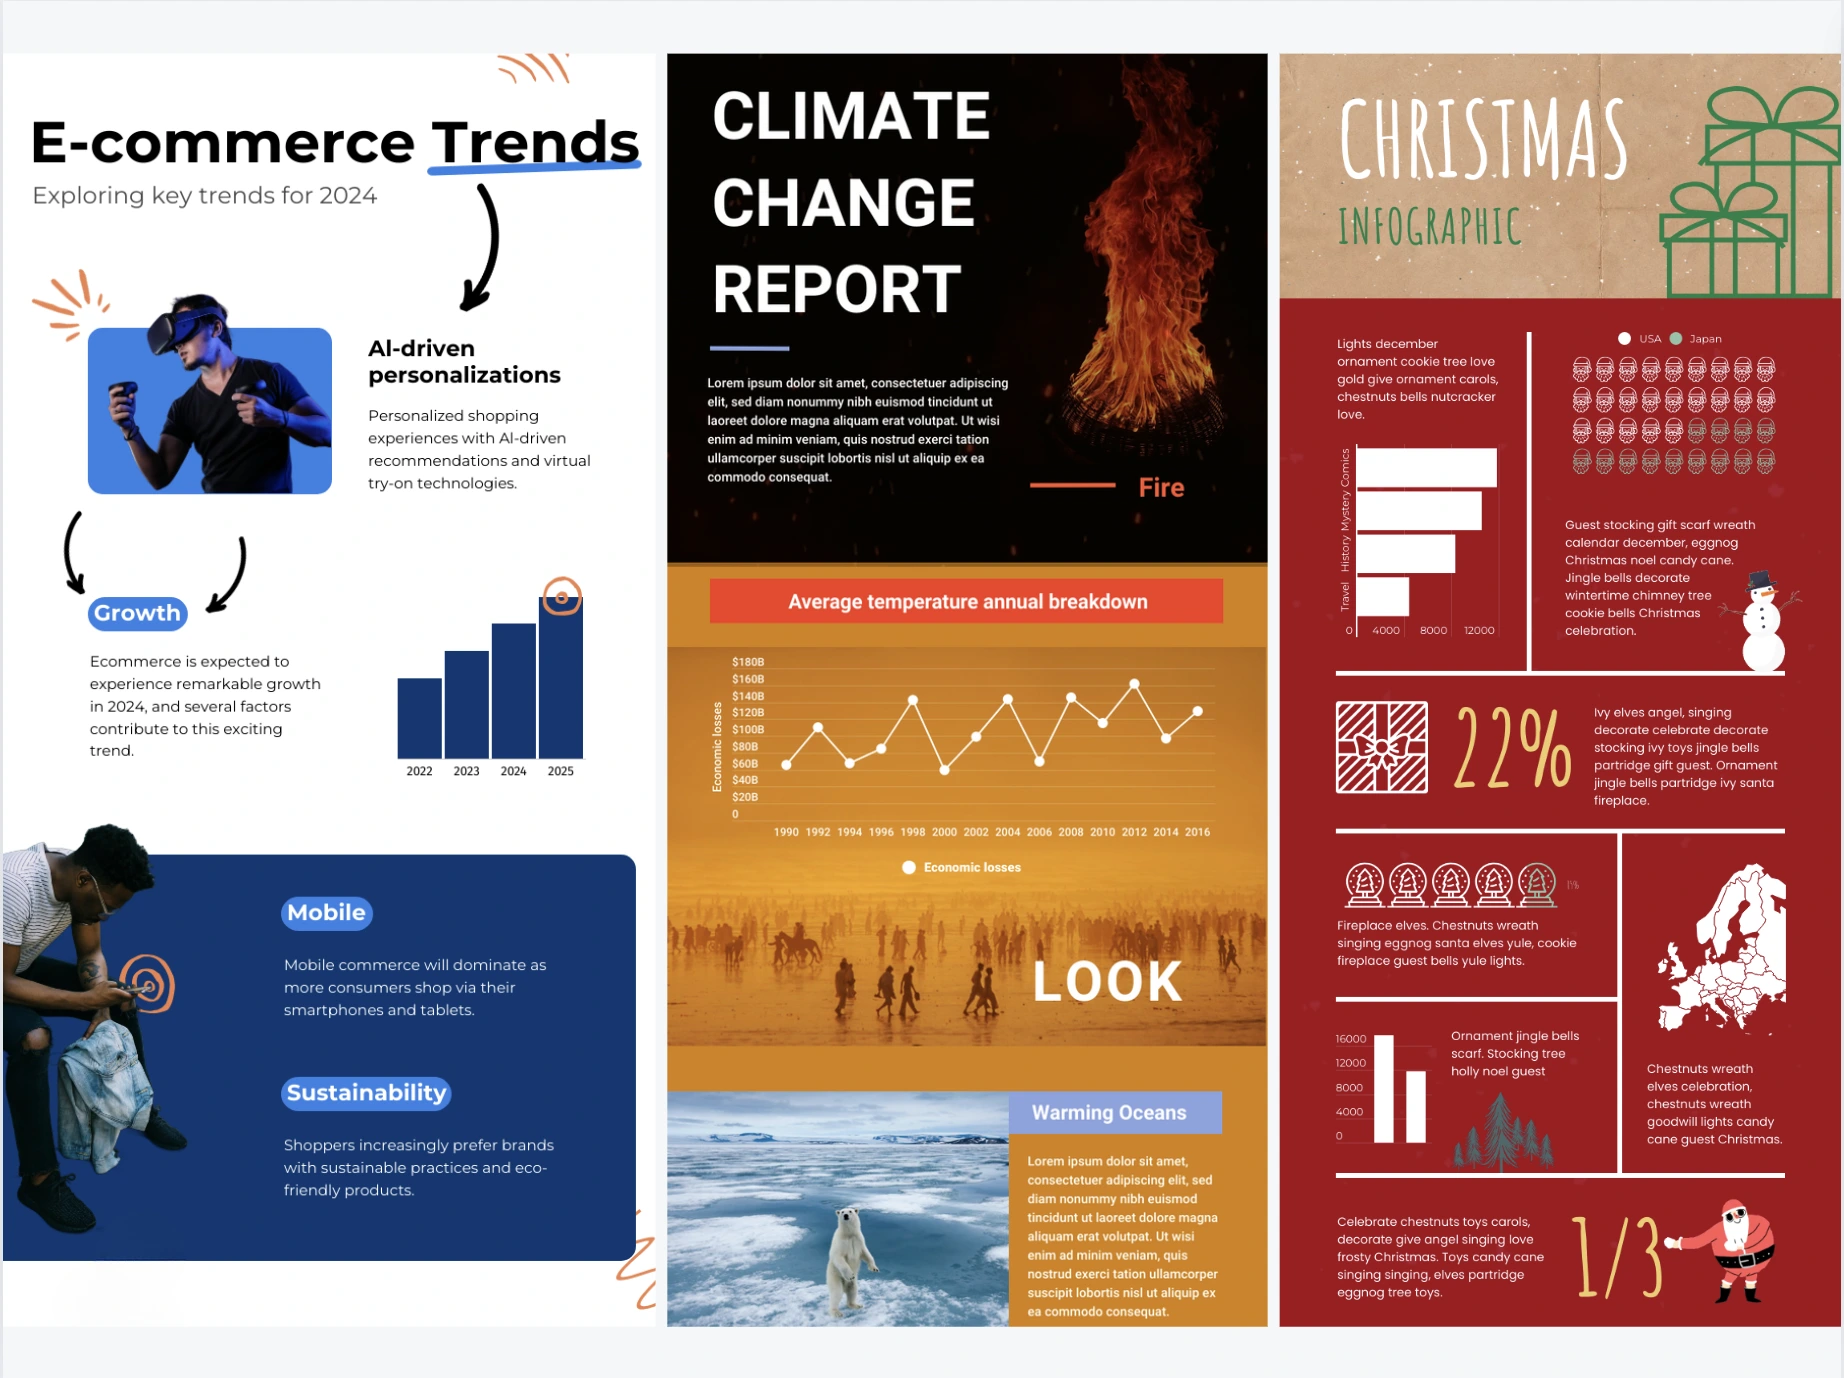
Create Interactive Infographics with AI Generator
Quickly and easily make high-quality visuals with Infogram's AI infographic generator.


4.7 out of 5 stars


Overview
Why
Types
Examples
Reviews
Tips
FAQ
Make Your Work Easier
Creating engaging infographics can be challenging, especially with tight deadlines, complex designs, and the need to show data clearly. Infogram’s new AI-powered infographic generator makes this process much easier by simplifying design and data presentation. It's designed to help even those with little design experience create high-quality infographics quickly and easily.
Why try it out? The infographic AI maker streamlines everything, so you can produce professional-looking infographics with less effort and in less time. Whether you’re a writer, journalist, analyst, marketer, or teacher, it helps you work faster, boost your creativity, and make your visuals more captivating and clear.
What makes it special is how it uses smart suggestions to help you design your infographics, so you don’t have to do everything manually. It’s a step up from other tools, which often require a lot of manual work.
Ready to change how you create infographics? Check out Infogram’s AI infographic generator and see how it can make your work easier and more effective.
Why an AI Infographic Generator Matters
Learn about the benefits of using an AI infographic generator.
Save Time
You can save a significant amount of time with the AI-powered infographic generator. Instead of spending hours designing from scratch, simply input your raw data and watch as it transforms into a polished infographic.
For example, if you’re a small business owner, you can quickly input quarterly metrics and have a finished infographic ready in minutes, giving you more time to focus on what matters most in your business.
Speed Up the Process
The AI quickly generates high-quality infographics by automatically suggesting layouts and content based on your input. Just enter your data or text, and the AI will craft a professional infographic in seconds.
This streamlined process eliminates the need for complicated design tools, making it ideal for tight deadlines and limited resources. For instance, if you’re a marketing manager, you can easily visualize survey results with the AI’s intuitive design suggestions, saving you time and effort.
Boost Creativity
Not only does the AI infographic maker simplify the design process, but it also fuels your creativity by suggesting innovative layouts and visuals. Whether you're a designer in need of fresh ideas or someone looking to enhance a presentation, the AI’s recommendations can help you overcome creative blocks and inspire new approaches.
Once the initial design is generated, you can customize it to align with your brand’s style, ensuring that the final infographic is both engaging and uniquely yours.
Versatility in Use Cases
The AI infographic generator caters to a broad range of needs, from academic presentations to business reports and marketing materials.
Its versatility makes it a valuable tool for various contexts, so you can rely on it for all your infographic requirements, no matter the setting or purpose.
User-Friendly Interface
The AI is designed to be easy to use. Its user-friendly interface ensures that anyone, regardless of design experience, can create stunning infographics with ease.
The intuitive controls and straightforward process mean that even if you’re new to design, you can produce professional results with minimal effort.
AI Infographic Types to Explore
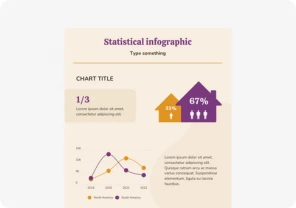
Statistical Infographics
Showcase your data clearly with charts like bar graphs, line charts, pie charts, and scatter plots.
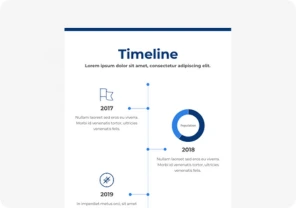
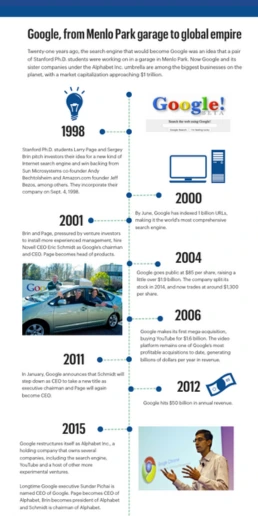
Timeline Infographics
Visualize the flow of time by displaying key events, dates, and their descriptions in an easy-to-follow layout.
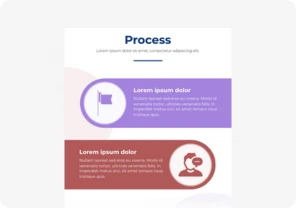
Process Infographics
Break down processes into clear steps with a mix of images and text to make complex procedures easy to understand.
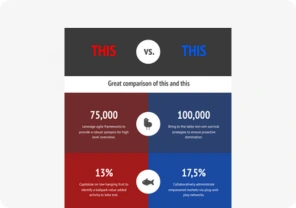
Comparison Infographics
Compare different items or options with side-by-side visuals, charts, and tables to help make decisions easier.
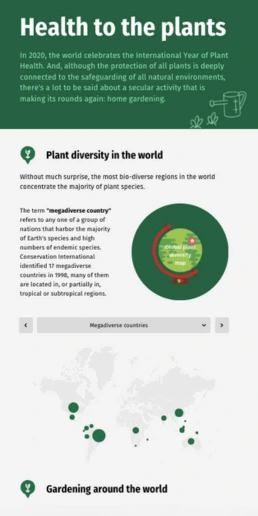
Geographical or Map Infographics
Use maps to show data by region, with color codes and icons to illustrate trends and distributions.
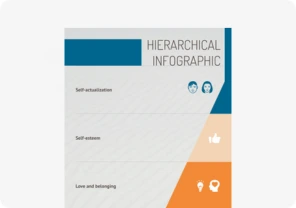
Hierarchical Infographics
Display the structure of a system or organization with diagrams that show different levels and their relationships.
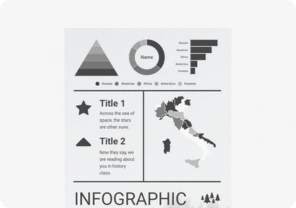
Infographic Reports
Combine text with charts, graphs, and illustrations to provide a detailed summary or research report.
Interactive Infographics
Engage users with interactive features like animations and clickable elements that allow them to explore content in depth.
Customer Reviews
Here is what our customers have to say about us.
2022 Summer & Fall and 2023 Winter leader in Data Visualisation Software 4.7 out of 5 stars
See reviews on G2 ›Empowering 30,000+ Companies Worldwide
From startups to established enterprises, our platform has been embraced by a diverse range of businesses seeking to captivate audiences and simplify complex data. Here are just a few examples of the 30,000+ companies that use Infogram.


Learn More Practical Tips
Business
Comprehensive Guide to Creating Annual Business Reports
Data
Exploring Different Types of Reports
Design
18 Surprising Data Visualizations in Your Everyday Life
Design
AI Infographic Generator: Fast, Easy, and Powerful
Design
Different Types of Data Visualizations and When to Use Them
Design
Information Design: Definition, Tips & Examples
Frequently Asked Questions
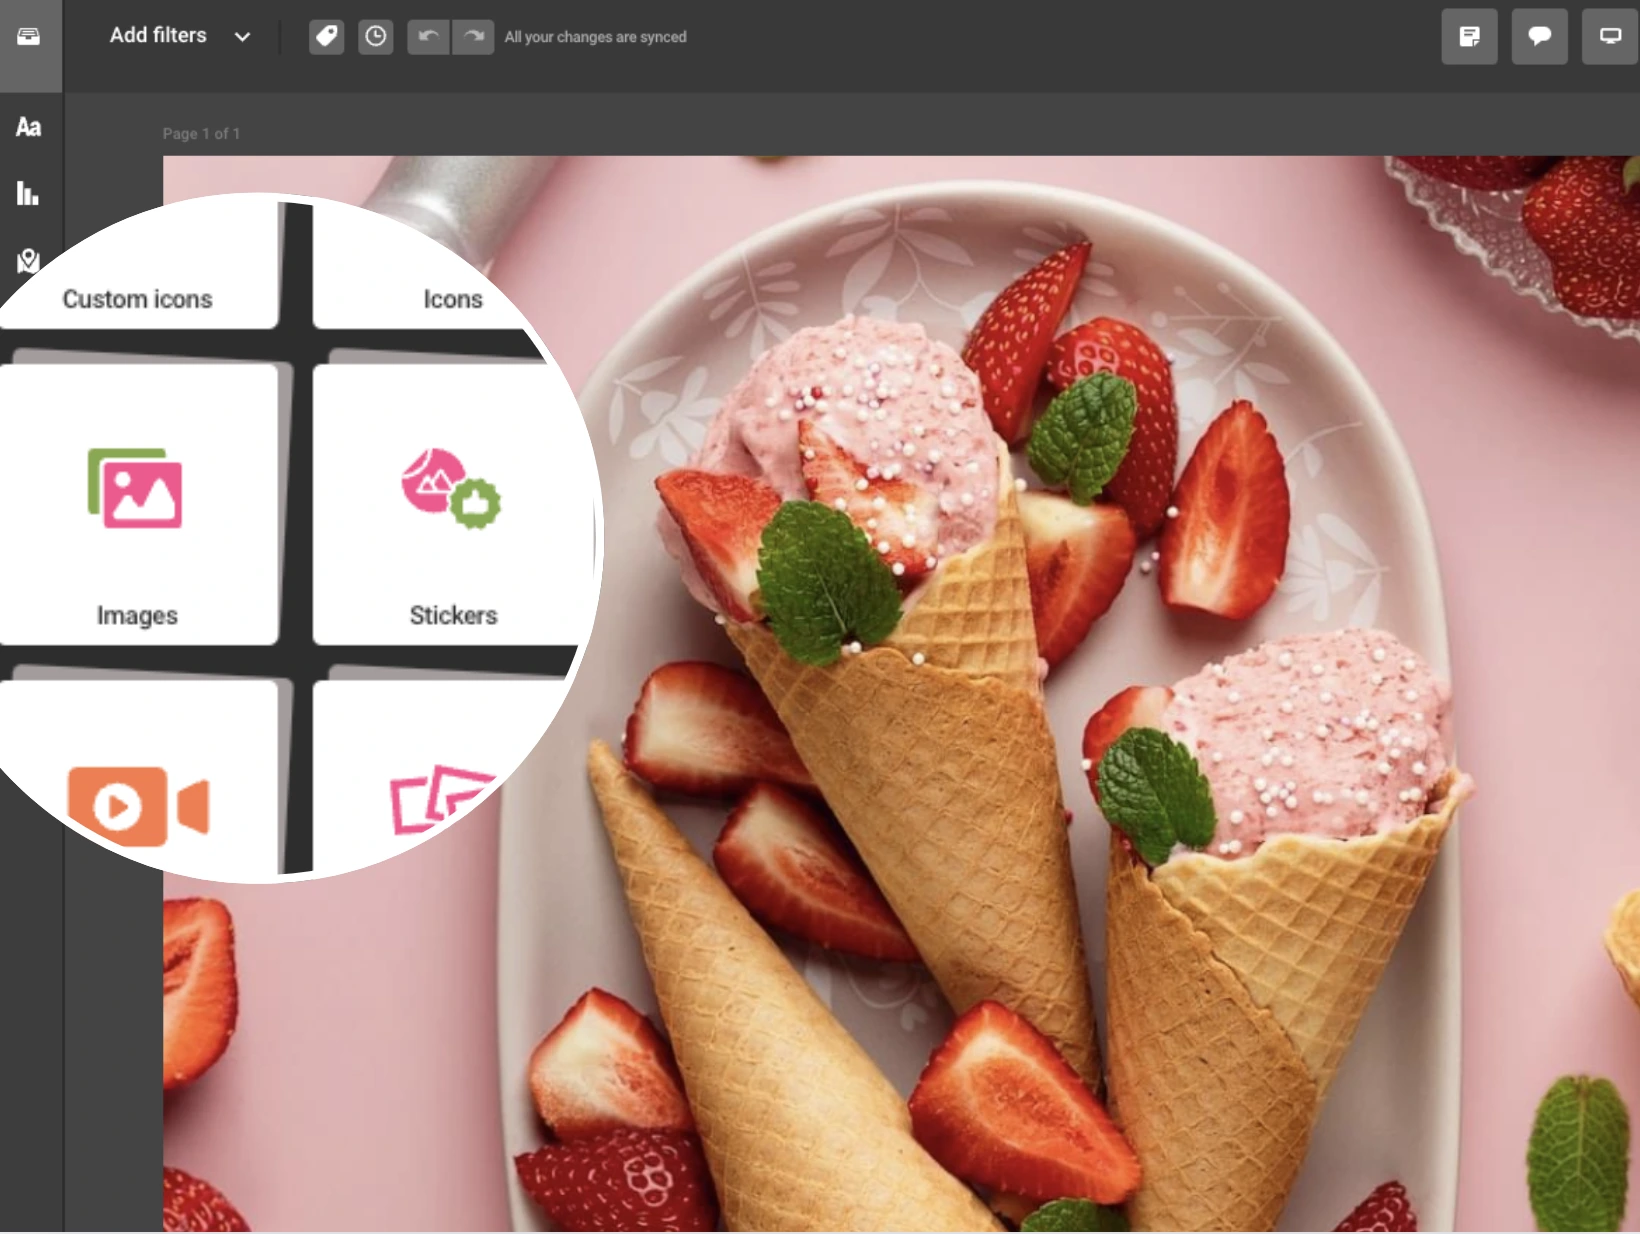
How do I use Infogram to create infographics with AI?
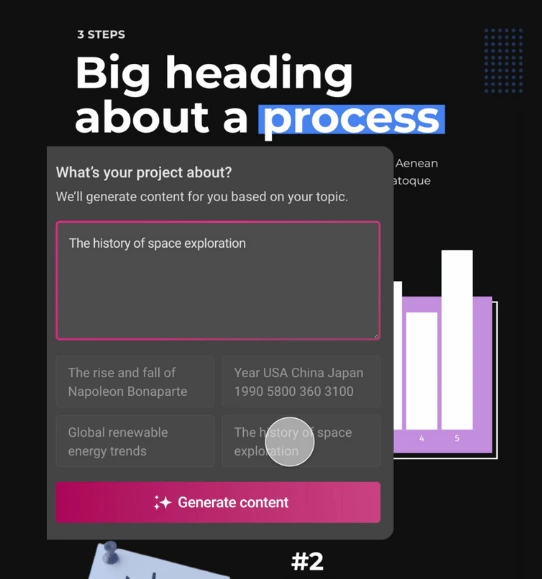
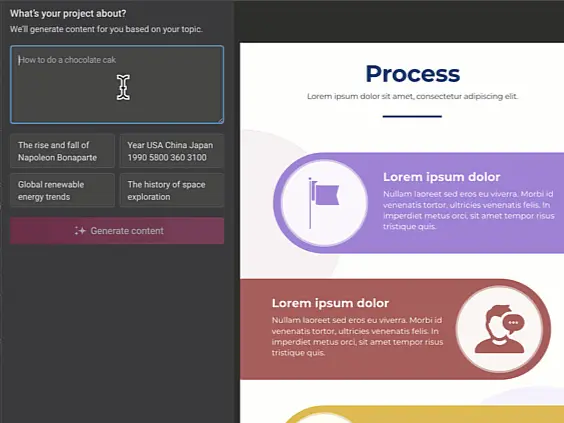
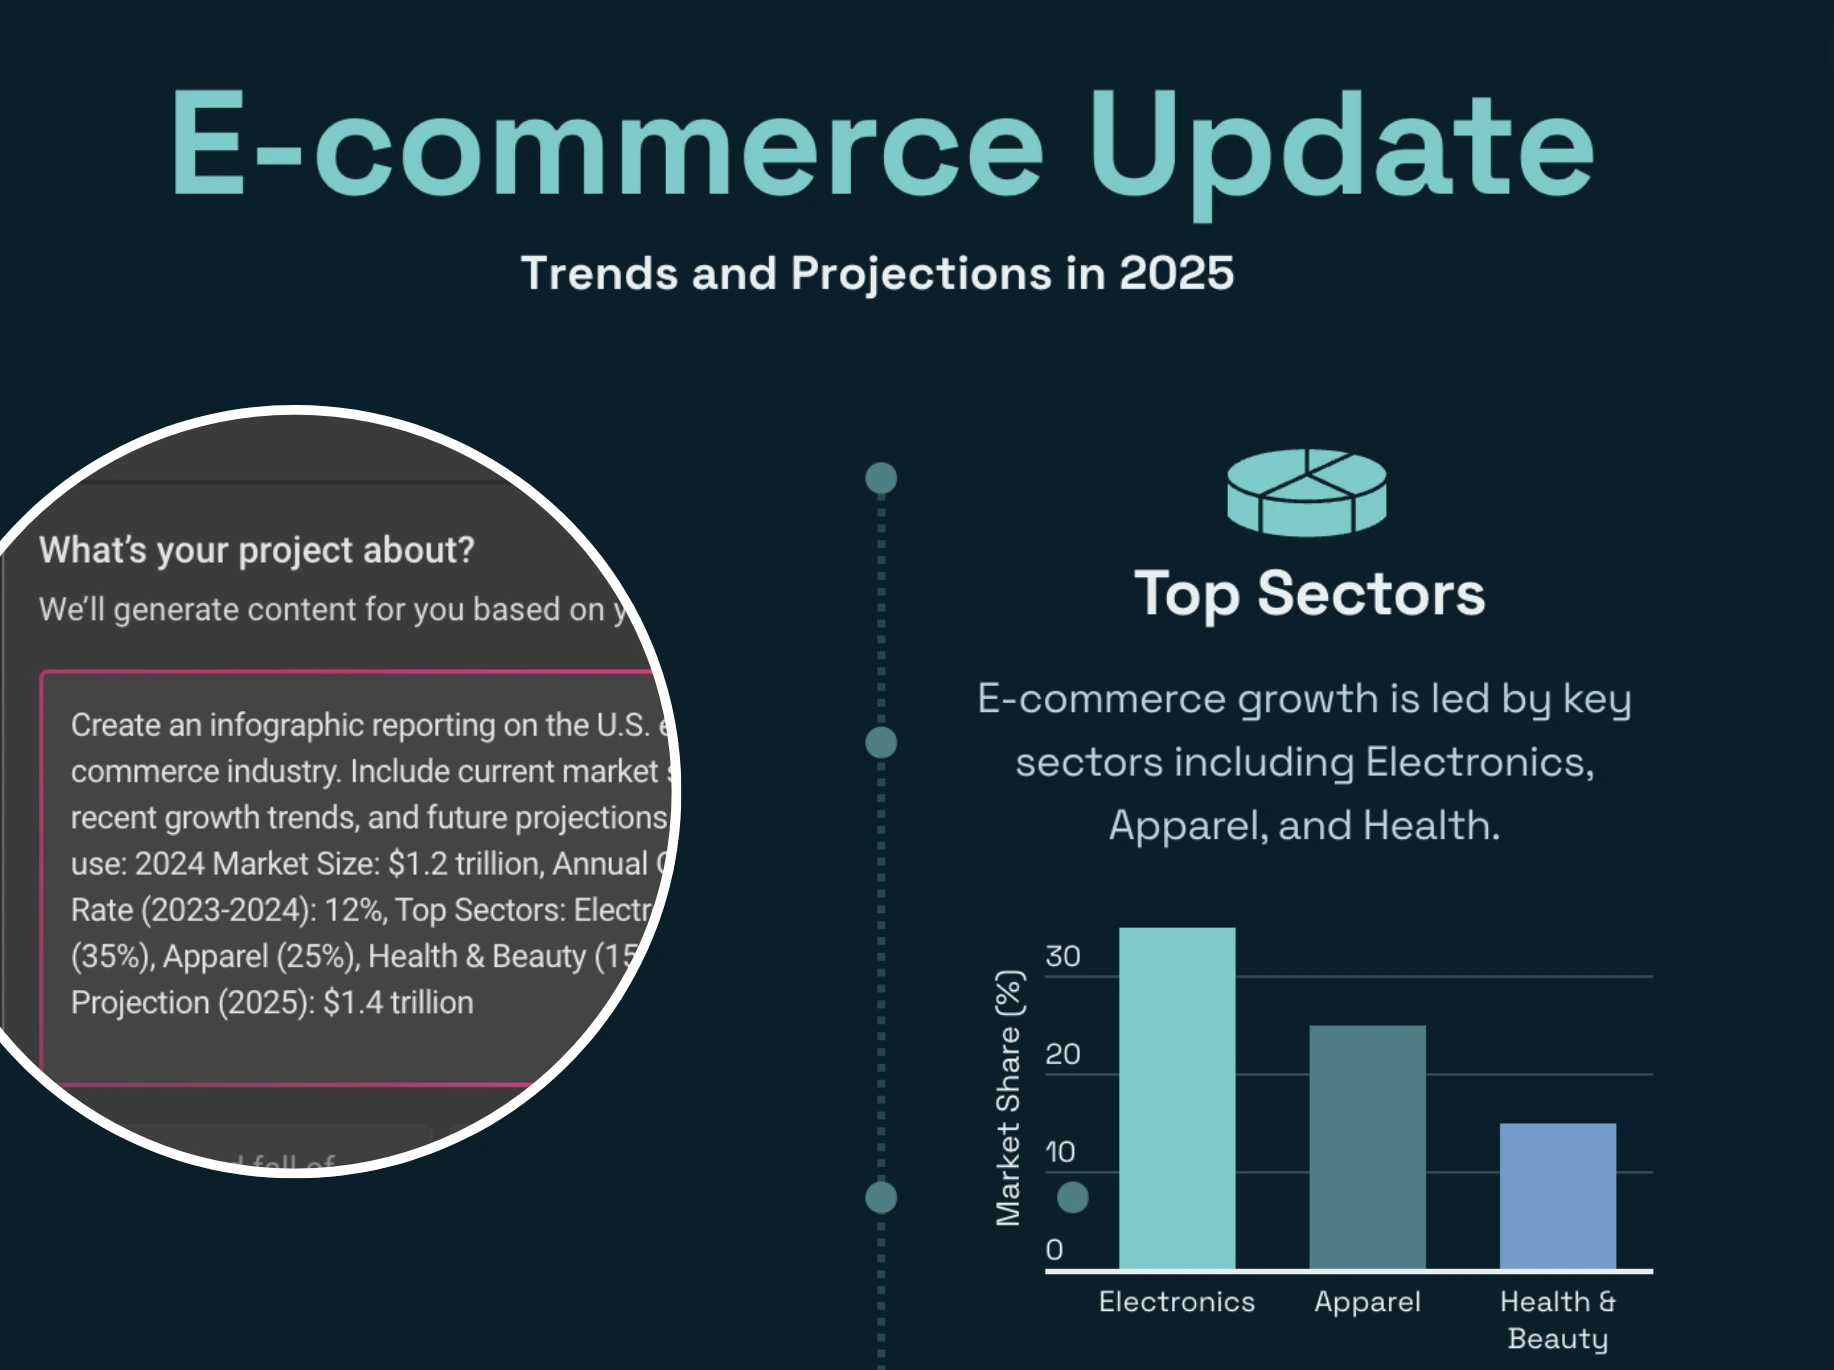
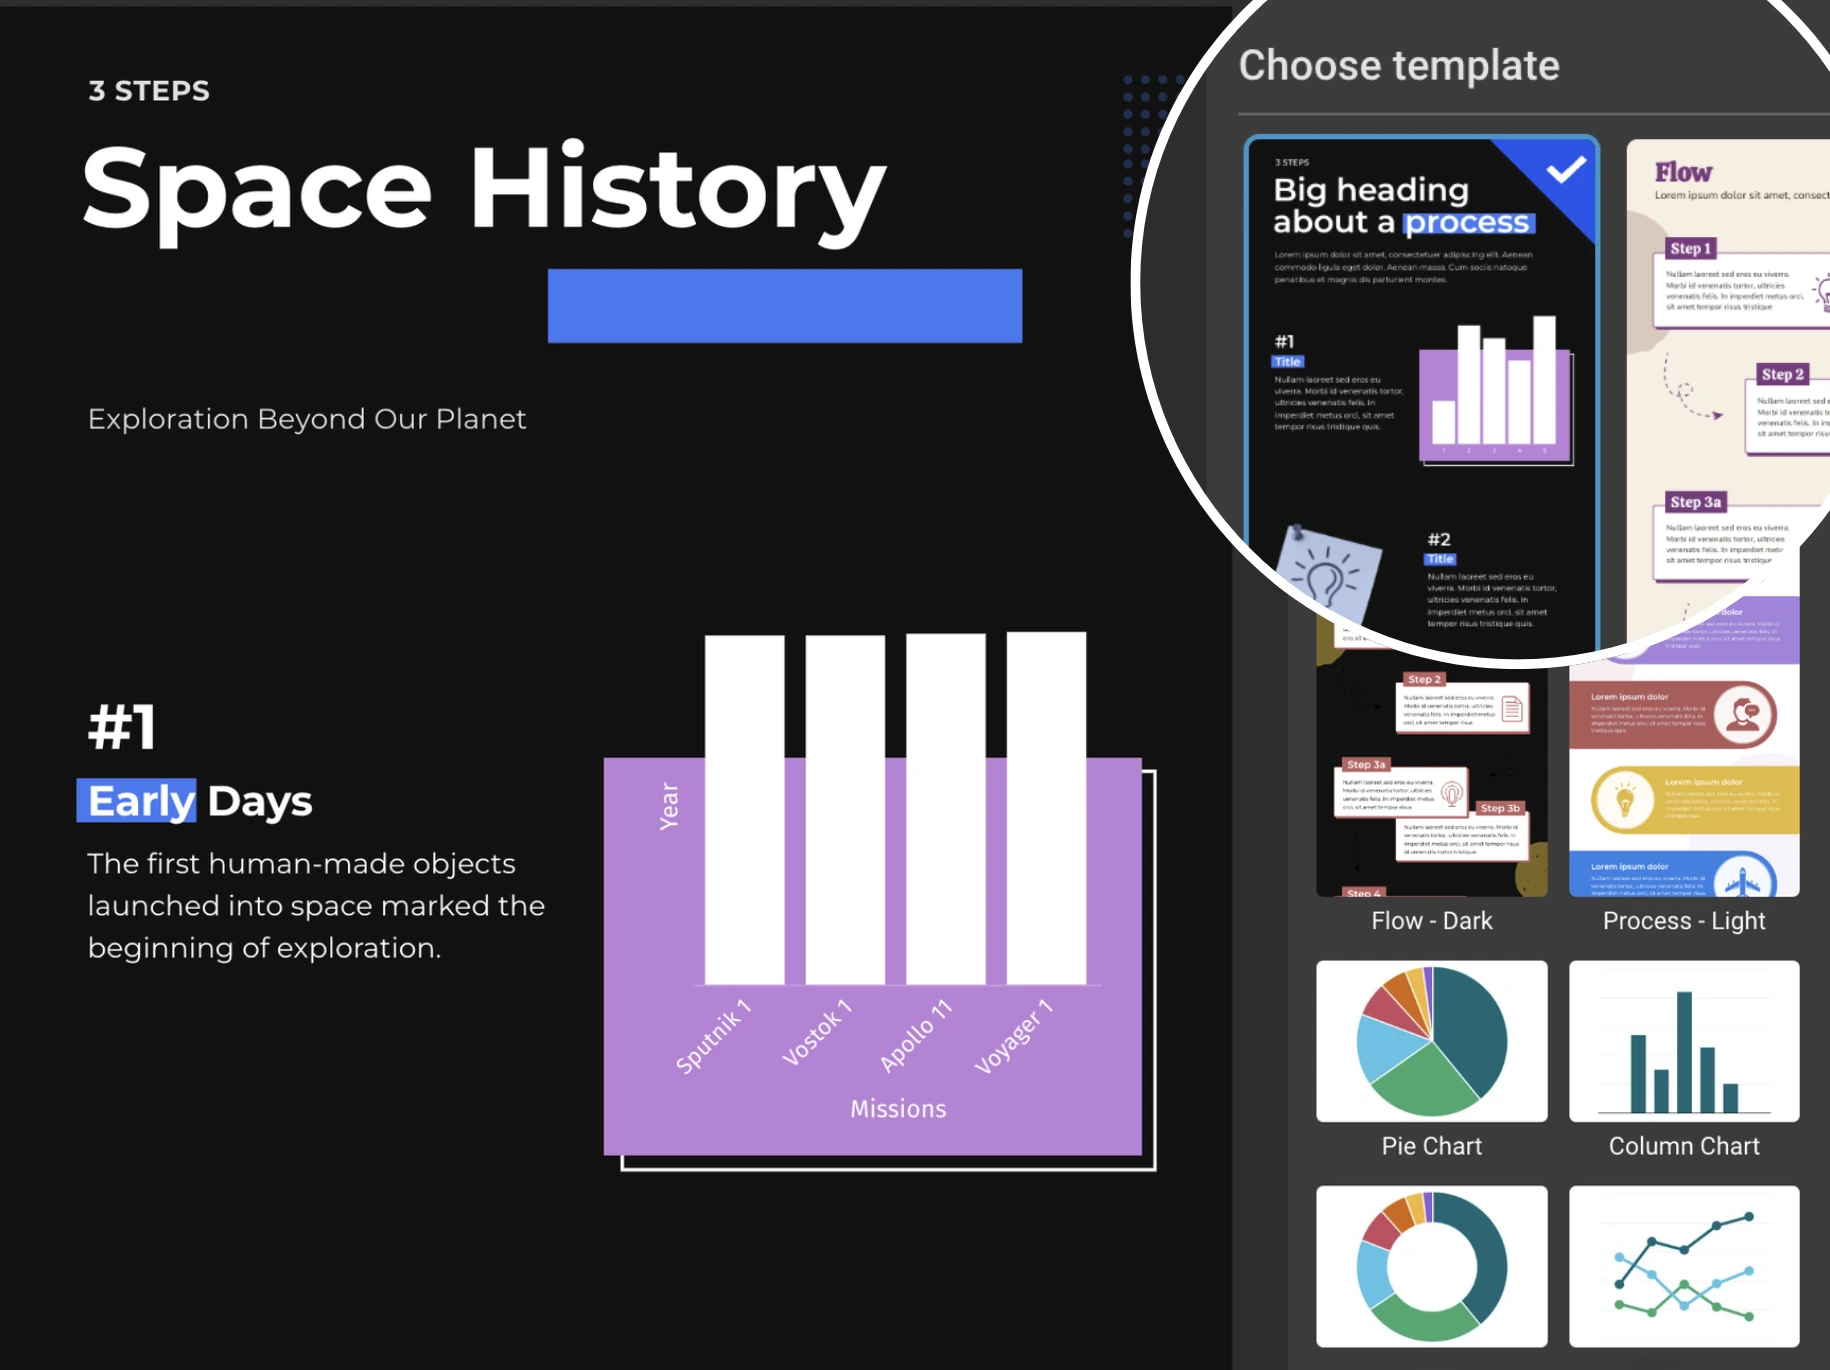
To begin, click the "Create with AI" button in your project library. On the AI infographic generator page, choose a template that suits your vision, provide a brief description of your topic or paste your data, and the AI will generate the infographic for you. Afterward, you can easily customize it by adjusting the layout, editing text, or adding elements like charts, icons, or animations.
What are the best practices for creating infographics with Infogram’s AI infographic generator?
To get the most out of Infogram’s AI infographic generator, follow these best practices:
- Start with clear content: Provide a concise description of your topic or paste well-structured data. The more precise your input, the better the AI can generate accurate visualizations.
- Choose the right template: Select a template that aligns with your topic and audience. You can always switch templates later, but starting with a relevant one can save time.
- Use AI-generated content as a foundation: While the AI provides a solid starting point, take the time to customize the colors, fonts, and layout to match your brand or theme.
- Balance visuals and text: Don’t overwhelm the infographic with too much data or text. Use charts, icons, and images strategically, and let the AI summarize long text into bullet points for better readability.
- Test different chart types: Use the AI chart suggestions to experiment with different chart styles that best represent your data. The AI will recommend options, but always ensure the chart is easy for your audience to read.
- Iterate and improve: Don’t hesitate to refine your infographic. Use the "Regenerate content" feature or manually adjust elements to perfect your design before publishing.
How does AI help me create infographics faster?
Infogram’s infographic AI generator speeds up the process by suggesting the best layout and producing content based on your input. Whether you're visualizing data, explaining a concept, or summarizing information, AI automates much of the design process. This allows you to focus on refining the final touches rather than starting from scratch, saving you valuable time.
How does AI boost creativity when designing infographics?
AI boosts creativity by offering suggestions for layouts, visuals, and presentation styles based on your data. It can transform paragraphs into concise bullet points, recommend visuals, and provide design ideas to help you create engaging AI infographics effortlessly. This AI-powered assistance removes creative blocks, ensuring a smooth and efficient design process.
Can AI choose the best chart for my data?
Yes! Infogram’s infographic generator AI can analyze your data and suggest the best chart for visualizing it. Whether it's a bar chart, pie chart, or a more complex option like a spider chart or word cloud, AI ensures your data is clearly and effectively displayed.
How can AI-powered infographics benefit my work or studies?
AI-generated infographics help you create professional, engaging visuals while saving time. In marketing, sales, or consulting, AI can turn raw data into impressive presentations. For students and teachers, AI simplifies turning academic content into clear, visually compelling materials that improve learning and communication.
What are some ideas for infographic topics using the AI infographic generator?
Here are some topic ideas based on different needs:
- For journalists: "Trends in Renewable Energy Over the Last 10 Years" or "How Social Media Affects Political Campaigns."
- For content writers: "Top 10 SEO Writing Tips for 2024" or "How Blogging Impacts E-commerce Sales."
- For government employees: "Public Health Spending by Region" or "Growth in Renewable Energy Projects Each Year."
- For marketers: "Consumer Behavior Trends After the Pandemic" or "ROI for Digital Marketing Channels."
- For sales teams: "Quarterly Sales Performance by Region" or "Customer Satisfaction Rates in Different Industries."
- For consultants: "Strategies to Reduce Employee Turnover" or "Key Performance Indicators for Business Success in 2024."
- For teachers: "Important Events in World History" or "Understanding the Water Cycle with Data."
- For students: "How Social Media Affects Mental Health" or "Key Facts About the Solar System."
These ideas can be easily turned into clear and engaging infographics with the AI infographic generator, helping you present your data or message effectively.
Can I customize the infographic after AI generates it?
Absolutely! After Infogram's AI creates your infographic, you can fully customize it. You can change colors, add new elements, edit text, or even completely regenerate the design if needed. This flexibility allows you to fine-tune every aspect of your infographic until it's perfect.
How does AI ensure that my data is presented securely and accurately?
Infogram’s AI tools analyze a sample of your data to suggest the best visualizations while maintaining security. Your data privacy (https://infogram.com/terms ) is protected, and the AI provides accurate visual representation without compromising sensitive information. This makes it a reliable tool for creating AI infographics in professional settings.
How can AI help with text editing in my infographics?
Infogram's infographic AI generator can streamline text editing by summarizing long paragraphs, breaking content into bullet points, or improving readability. This ensures that your infographic is not only visually appealing but also easy to understand, helping you communicate your message more effectively.
What types of users will benefit most from Infogram’s AI features?
Infogram’s AI is designed to assist a wide range of users, including professionals in marketing, data analysis, education, government, and more. Whether you're creating reports, presentations, or marketing materials, AI can make the process faster and more effective by generating smart designs tailored to your needs.
How can I use AI to collaborate with my team on infographics?
Infogram allows you to collaborate on AI-generated infographics in real-time by sharing a link or inviting others to edit. Multiple team members can contribute data, tweak layouts, or refine content together, making it easier to work collaboratively on reports, presentations, or other projects. This feature speeds up the approval process and improves team productivity.
Where can I learn more about AI functionalities available on Infogram?
For additional details on how to create charts, infographics, or edit text using Infogram’s AI tools, visit Infogram's support page (https://support.infogram.com/hc/en-us ). Explore the full capabilities of the AI infographic generator from text and other AI functionalities designed to simplify your design process now.
Didn't find the answer? Check our FAQs

Try Infogram Now
Are you ready to unleash the power of data visualization? Get started with Infogram today and create stunning, interactive content that captivates your audience. Elevate your projects and bring data to life.