28.06.2016 by Infogram
Interactive charts and maps can add depth and intrigue to any article, presentation, or website. With Infogram, it is easy to create interactive charts and even easier to embed them online. Our charts are also responsive, which allows you to share your data in an engaging way across platforms.
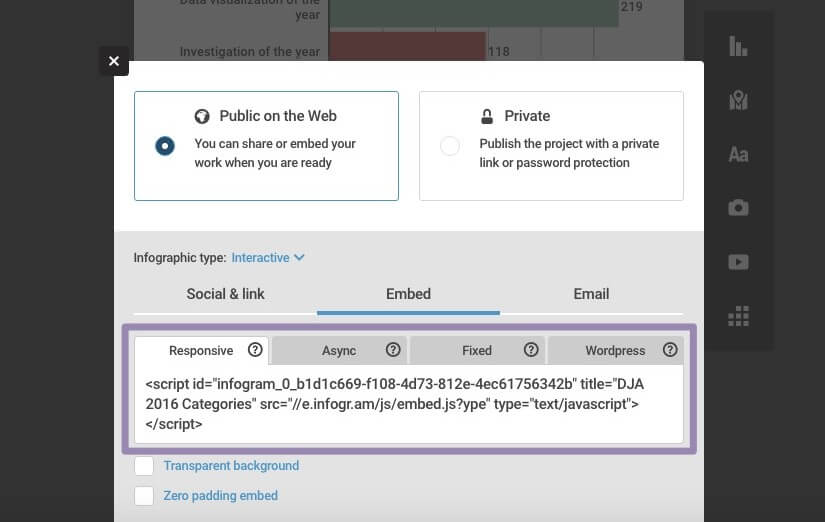
Simply publish your project, copy the HTML code provided, and paste it into the text editor of your CMS or the space provided by the tool you’re using. We’ve selected a couple easy ways you can share Infogram’s interactive charts online.
Want to learn how to make better charts? Download our latest eBook for a few simple data visualization techniques, beginner to pro – it’s free!

WordPress
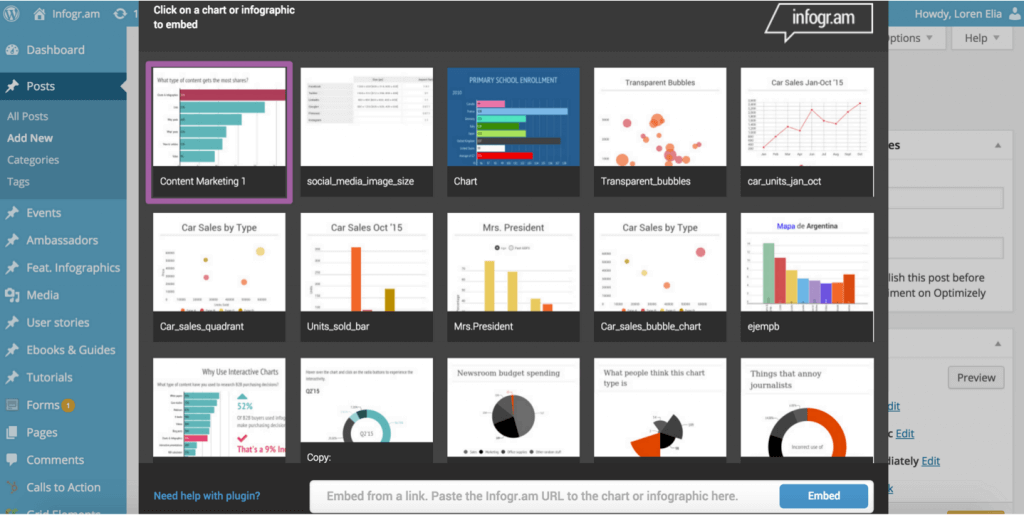
Popular blogging site WordPress lets you copy and paste Infogram embed codes straight into the text view editor. You can also download the Infogram WordPress plugin!
The plugin allows you to access your entire project library directly from the WordPress visual editor. The plugin supports one-click embedding of any project you’ve published or any publicly available chart or infographic made with our tool using the URL.
Installation:
- Install Infogram either via the WordPress.org plugin directory or by uploading the files to your server /wp-content/plugins/ directory
- Activate the plugin through the ‘Plugins’ menu in WordPress
Bunkr
Data visualizations make your presentations attractive and memorable. Presentation tool Bunkr makes it really easy to add interactivity to your work. Click ‘add chart’ and paste Infogram’s responsive embed code. We told you it was easy. Check out this fun presentation created by Bunkr.
Weebly
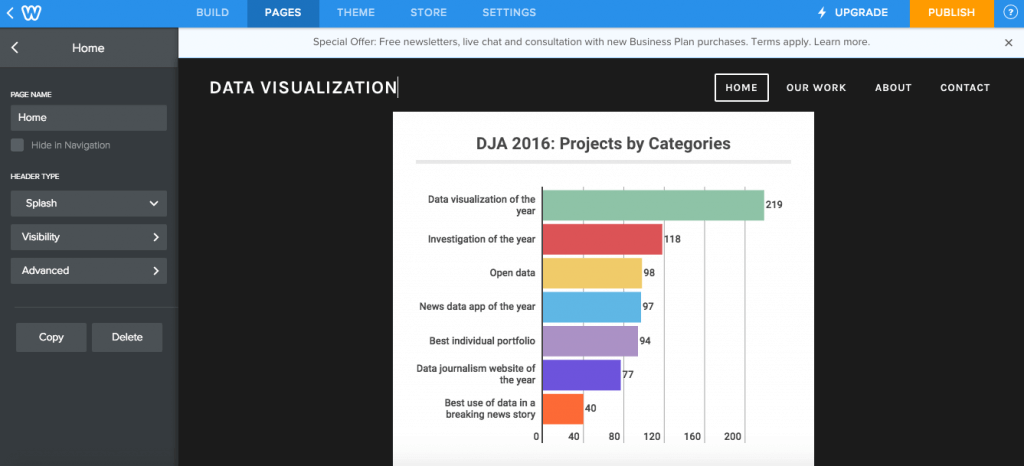
Weebly makes website design a snap. Luckily, they also make adding interactive charts simple too. From the Weebly editing view, you can add an ‘embed code’ block to the web page you’re working on. Paste Infogram’s embed code to view the interactive chart on your website and enjoy!
Slides
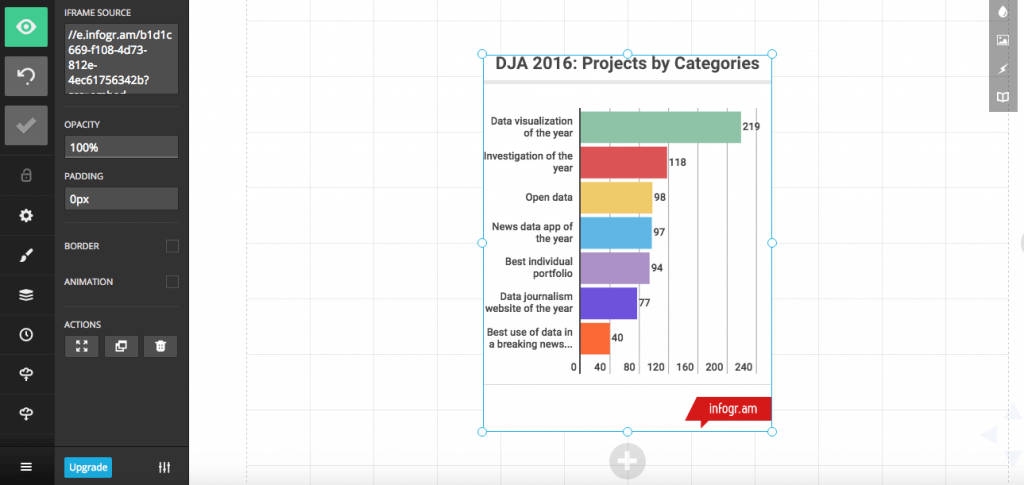
Slides is a place for creating, presenting and sharing slide decks – built perfectly for online interactivity. Begin by creating a new slide deck. Click to add an ‘iframe’ element from the editing menu. Then copy and past Infogram’s fixed embed code into the box on the top left. Your Infogram chart will appear right in front of you.
Download our latest eBook to learn simple data visualization techniques to make your charts 110% more engaging. We’ll show you how to pick the right topic, organize your data, select the proper chart type, avoid common mistakes and make it look great.

Would you like to experience the full power of data visualization? Try Infogram for Teams or Enterprise for free! With a Team or Enterprise account, you can create up to 10,000+ projects, collaborate with your team in real time, use our engagement analytics feature, and more. Request your free demo here.
Get data visualization tips every week:
New features, special offers, and exciting news about the world of data visualization.