26.11.2024 by Anete Ezera
At Infogram, we’re committed to providing tools that make your data visualizations both detailed and accessible. Our latest update introduces a broader range of geographic maps, giving you the flexibility to choose the perfect view for your needs and ensure your visualizations deliver clear, contextual insights.
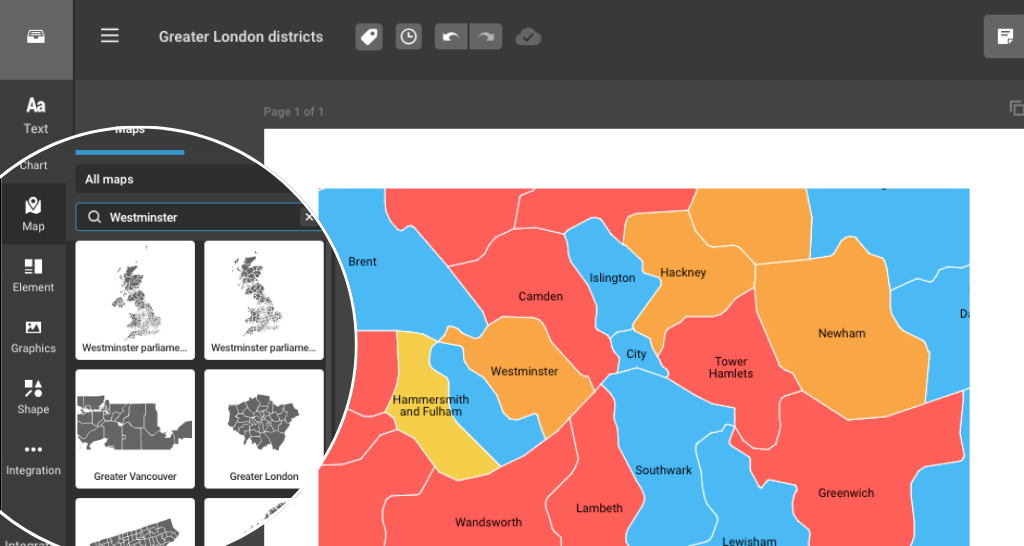
The updated map search allows you to seamlessly explore specific locations and their related regions. For instance, a search for “Westminster” will provide a detailed map of the borough as well as related maps for Greater London, England, and the United Kingdom. This means you can focus on a neighborhood or zoom out to present a regional overview—whatever suits your project best.
The search feature has also been improved to recognize typos and similar terms. For example, typing “Westminstr” will still display maps of Westminster along with relevant regions like London. These updates simplify the process of finding the right map, saving you time and effort.
More map options, more possibilities
This feature enables exploration of detailed geographic options within Infogram’s map offerings. Now you can:
- Pinpoint specific areas such as boroughs, districts, or neighborhoods within larger cities.
- Access broader maps for regional or national perspectives.
- Use related map options to align with diverse project needs, from local analyses to nationwide campaigns.
Previously, finding the right map often meant settling for overly broad results or spending extra time refining searches. With this update, those challenges are addressed head-on.

Practical use cases
- For analysts. When preparing a report on London’s economy, analysts can now include maps of specific boroughs like Westminster or Camden alongside maps of Greater London for added context.
- For marketing managers. Planning a campaign in South London? Easily locate maps for boroughs like Lambeth or Southwark, and switch to Greater London maps if needed.
- For journalists. Reporting on London’s housing market? Use borough maps to highlight localized trends while providing a broader context with maps of England.
- For content writers. Writing an article about London’s neighborhoods? Accurately showcase areas like Hackney or Kensington with tailored maps.
- For designers. Create visually striking infographics by combining detailed borough maps with larger regional visuals to match brand messaging.
This update goes beyond improving search functionality – it redefines how you present geographic data. By offering more detailed maps and flexible options, you can now tailor your visualizations to fit your audience’s needs, whether it’s zooming in on a specific area or framing it within a regional context.
Ready to access more detailed maps for your projects? Visit our help center or check out the feature guide. Log in to your Infogram account today and start creating precise, impactful visuals with ease!
Get data visualization tips every week:
New features, special offers, and exciting news about the world of data visualization.