19.09.2023 by Infogram
We are excited to introduce our latest Infogram feature – table chart border customization. With this powerful addition, you now have the ability to customize table borders and individual cells, enabling you to create compelling reports, dashboards, infographics, and more that’ll captivate your audience and elevate your data visualizations.
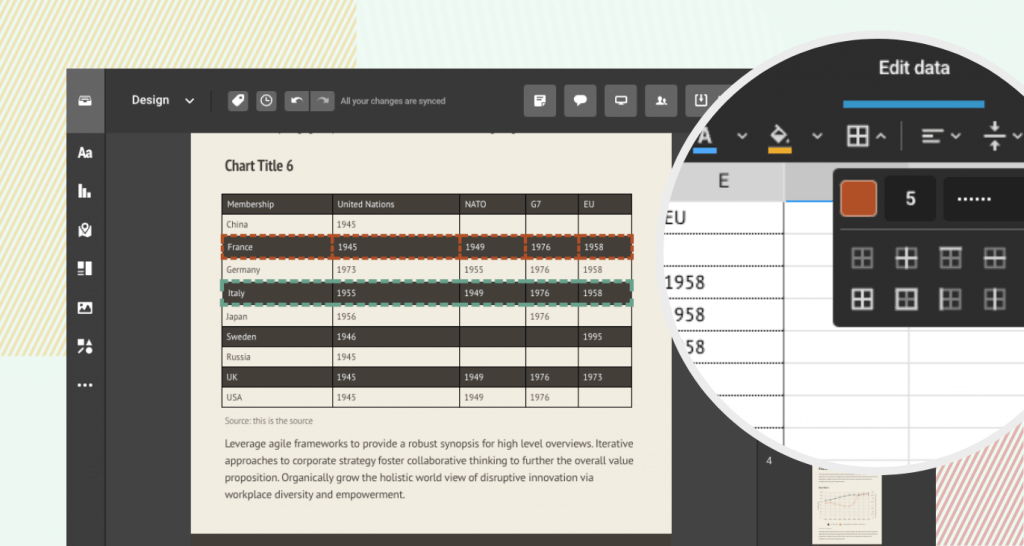
Our table chart border styling feature facilitates complete control over the appearance of your tables and cells. Here’s what you can achieve:
- Style color: Select from a diverse range of colors to align with your brand or convey data significance effectively.
- Thickness: Fine-tune the thickness of your table borders to ensure they either stand out prominently or seamlessly blend with your design.
- Size: Tailor the size of table borders and cells to establish a clear visual hierarchy and emphasize critical data points.
- Pattern: Apply various border patterns to your tables and cells, adding a touch of creativity or emphasizing specific data elements.
How does it benefit you?
- Bring clarity and highlight important metrics. Effortlessly accentuate essential data points, headers, or sections within your tables by adjusting border colors, thickness, and patterns. This ensures that your audience can swiftly identify crucial information.
- Ensure brand consistency. Maintain visual consistency with your brand’s identity by selecting the ideal color palette and border styles for your tables.
- Show professionalism. Impress your colleagues, clients, and website visitors with polished, professional-looking reports, dashboards, and infographics that reflect your attention to detail.
With the table chart border styling feature, you gain the ability to craft striking, tailor-made tables that not only leave a lasting impression on your audience but also assist you in achieving success in your reports, dashboards, infographics, and website projects. Elevate your next data visualization project with Infogram—try our new feature today and experience the difference!
For a step-by-step guide on how to change table borders, please read our instructional article.
Get data visualization tips every week:
New features, special offers, and exciting news about the world of data visualization.