26.11.2024 by Infogram
At Infogram, we’re dedicated to providing tools that make data presentation both clear and impactful. Our newest feature allows you to link directly to specific objects within your project – not just pages or chart tabs. This feature enables you to create interactive, scrollable infographics, reports, and more that guide viewers precisely where you want them to go with a single click.
What is linking?
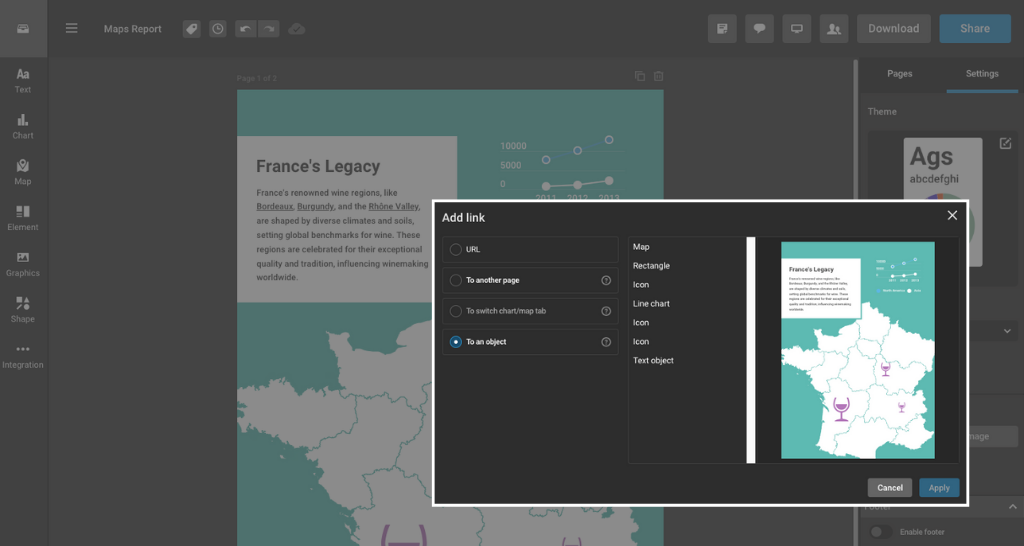
The linking feature allows you to assign hyperlinks to specific objects within your Infogram project. Instead of being limited to linking to an entire page or chart tabs, you can now direct your audience to specific sections or elements within a page.
For example, you might link to a particular data chart, a section of an infographic, or even an individual element. Additionally, the redesigned “Add Link” dialog makes it simple to add, edit, or remove links, offering a smoother and more efficient editing experience.
Addressing common challenges
Creating long, detailed projects often comes with several challenges:
- Navigation issues. Viewers may struggle to find relevant information in lengthy documents.
- Limited linking options. Previously, linking capabilities were restricted to larger sections, making it harder to emphasize specific details.
- Time-consuming edits. Adjusting or removing links often required multiple steps, slowing down the workflow.
Object linking tackles these challenges directly:
- Seamlessly guide users. Help viewers navigate complex documents by linking to relevant sections or objects.
- Highlight key information. Draw attention to the most critical parts of your content with precise linking.
- Save time. Easily edit or remove links with the improved link management interface.
Practical use cases
Here’s how object linking can benefit you:
- For analysts. Create detailed reports where stakeholders can click on specific data points, such as quarterly performance charts or critical metrics.
- For marketing managers. Build interactive campaign summaries that link to sections showcasing ROI, demographics, or engagement data.
- For journalists. Guide readers to key visuals in long-form stories, such as a timeline of events or in-depth data analyses.
- For content writers. Develop scrollable guides or tutorials where users can jump directly to relevant examples or key takeaways.
- For designers. Build branded, interactive infographics with clickable sections that improve user engagement and clarity.

The new object linking feature isn’t just about making navigation easier – it’s about transforming how you present data. By linking directly to specific objects, you can guide your audience through your story with precision and ensure that key details stand out.
Ready to create interactive infographics or reports? Discover how object linking can elevate your next project by visiting our help center or exploring the feature guide. Log in to your Infogram account today and give this powerful new feature a try.
Get data visualization tips every week:
New features, special offers, and exciting news about the world of data visualization.