20.02.2025 by Infogram
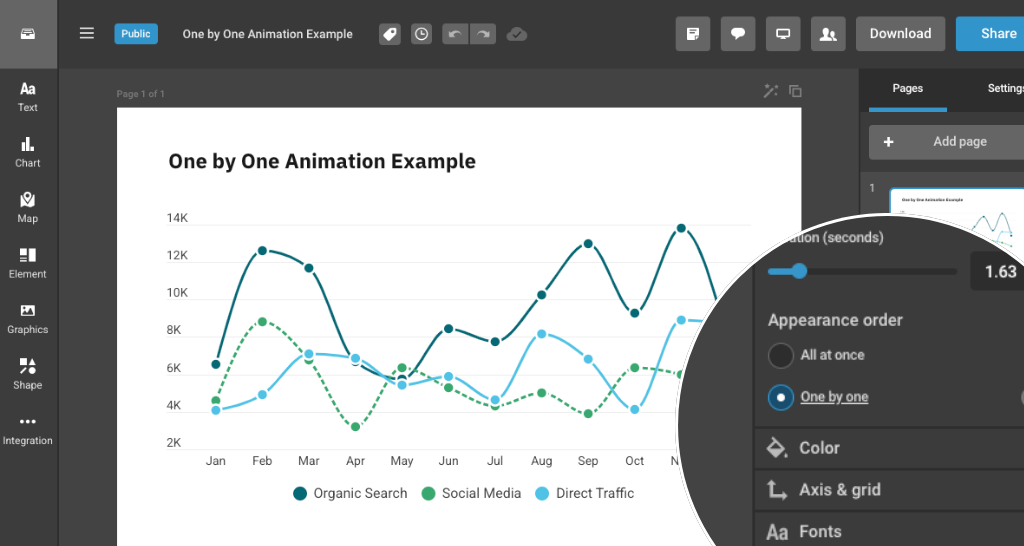
We are excited to introduce line chart animation customization in Infogram! This new feature allows you to control how your line charts animate, whether all at once or one line at a time. Plus, you can adjust the animation duration to create the perfect storytelling experience for your data.
At Infogram, we believe that data should not just be seen – it should be experienced. Animations help guide your audience through data insights, making trends more engaging and easier to follow. With this update, you can customize the pace of your data’s reveal, ensuring that key points are highlighted effectively.
Beyond engagement, animation customization provides more flexibility for content creators, marketers, and analysts. Whether you want to emphasize key data trends or create a step-by-step unfolding of insights, this feature empowers you to tell your story with greater impact.
With this update, your interactive reports, dashboards, and infographics become even more dynamic and visually compelling.
How these features help you:
- Data Analysts & Business Professionals: Present key metrics and performance trends in an intuitive way, helping stakeholders better absorb insights at their own pace.
- Marketers & Content Creators: Make campaign reports and social media analytics stand out with smooth, engaging animations that captivate your audience.
- Journalists & Reporters: Guide readers through data trends by animating lines one by one, ensuring a clear and structured storytelling approach.
Start exploring line chart animation customization in Infogram today and take your data storytelling to the next level!
Get data visualization tips every week:
New features, special offers, and exciting news about the world of data visualization.