
Visualize Trends with Interactive Line Charts
Create interactive line charts to present how variables change and develop, making complex datasets more accessible and understandable.


4.7 out of 5 stars


Overview
Why
Types
Examples
Reviews
Tips
FAQ
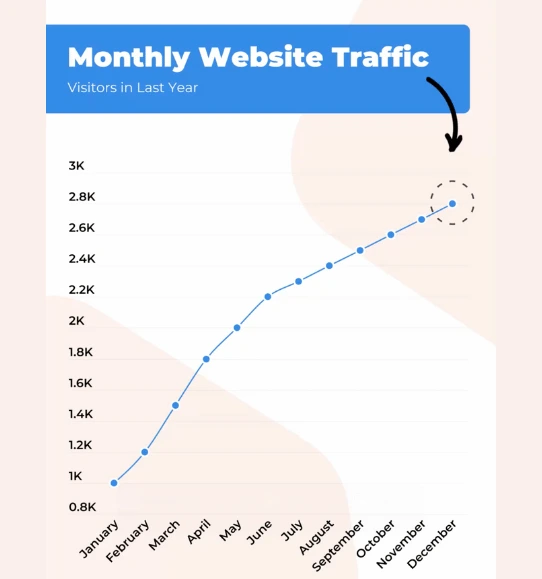
Provide a Clear Picture of Growth Using Line Charts
Line charts are a go-to choice in reports due to their effectiveness in illustrating data trends over time. They play a vital role in presenting how variables change and develop, making complex datasets more accessible and understandable. By visually mapping the trajectory of data points, line charts provide a clear picture of growth, decline, and patterns, helping readers quickly grasp temporal trends. Whether you're tracking quarterly sales, website traffic, or the performance of different investments, line charts offer a simple yet powerful way to showcase data fluctuations.
However, challenges can arise when incorporating line charts into reports. Handling large datasets with numerous data points can lead to cluttered charts that confuse readers instead of enlightening them. Additionally, accurately interpreting trends from intricate lines requires careful attention, as even slight variations can hold significant meaning. Furthermore, static line charts might limit reader engagement and their exploration of the data, which hampers their ability to draw nuanced insights.
This is where interactive data visualization tools come to the rescue. Tools like Infogram provide the means to create dynamic line charts that address these challenges. The ability to hover over points and access underlying data ensures accurate interpretation and reduces the risk of misanalysis. Furthermore, interactive line charts engage readers, enabling them to manipulate variables, explore historical patterns, and make comparisons. Infogram's customization options also allow users to emphasize essential points, add annotations, and integrate contextual information.
By harnessing the capabilities of interactive data visualization tools, you can overcome the challenges associated with static line charts. Infogram, for instance, empowers users to create engaging line charts that enhance data comprehension and promote active exploration. This not only elevates the quality of reports but also empowers readers to delve deeper into data trends, extract meaningful insights, and make informed decisions based on a comprehensive understanding of the information presented.
Explore Why Line Charts Are Useful
Explore why line charts are useful for your data visualization process.

Visualize Trends
Line charts excel at visualizing trends over time. They provide a clear representation of how data points evolve and enable users to identify patterns, growth, decline, or any significant changes occurring within a dataset.
Whether it's tracking sales figures, website traffic, or stock prices, line charts offer a straightforward way to understand and communicate temporal trends. They're a powerful tool for telling data-driven stories.

Compare Multiple Data Series
Plot multiple data series on the same chart, making it easy to compare and contrast different variables or categories. By displaying multiple lines, users can analyze how different factors change over time and observe any relationships or divergences between them.
This helps users identify connections, spot correlations, or investigate cause-and-effect dynamics within their data, enhancing their understanding of complex relationships.

Highlight Patterns and Anomalies
Line charts are excellent at highlighting patterns and anomalies in data. Users can quickly identify spikes, dips, or consistent trends that may indicate important insights or anomalies within their dataset.
These visual cues draw attention to noteworthy events or outliers, aiding in the detection of unusual behavior, exceptional performance, or unexpected deviations. Line charts act as magnifying glasses for data scrutiny.

Forecast and Predict
Line charts can be utilized for forecasting or predictive analysis by extending the lines beyond the existing data points. By extrapolating trends from historical data, users can make projections for the future and estimate potential outcomes.
Line charts provide a visual representation of these projections, enabling users to communicate and discuss potential future scenarios, making them a valuable tool for informed decision-making.
Line Chart Types to Explore

Basic Line Charts
Connect data points with straight lines to visualize trends over time, providing insights into growth, patterns, and comparisons.
Area Chart
Illustrate cumulative data or multiple series' composition over time by filling the area between the line and x-axis.

Multiple-Axis Line Charts
Simultaneously visualize multiple datasets with distinct scales on separate y-axes, revealing relationships and correlations.
Get Inspired by Infogram User Created Projects

How Guest Workers Affect Illegal Immigration

European income inequality begins to fall once again

Exploring how to predict viral Reddit posts

Flight of the Rohingya

La nafta arranca 2017 con suba del 8%

Total trade in goods as % of GDP, by country in the UK

1.8 Million in Employment‐Based Green Card Backlog

Labor MP slams $800 aged bonus for 1 million retirees
Customer Reviews
Here is what our customers have to say about us.
2022 Summer & Fall and 2023 Winter leader in Data Visualisation Software 4.7 out of 5 stars
See reviews on G2 ›Empowering 30,000+ Companies Worldwide
From startups to established enterprises, our platform has been embraced by a diverse range of businesses seeking to captivate audiences and simplify complex data. Here are just a few examples of the 30,000+ companies that use Infogram.


Learn More Practical Tips
Finance
A Practical Guide to Creating Financial Reports
Design
Map customization: 3 essential learnings to bring stories to your maps
Marketing
Data storytelling: Ingredients to an effective data story
Business
Comprehensive guide to creating annual business reports
Marketing
Marketing report: Everything you need to know to get started
Marketing
Progress report: What it is and how to write a progress report
Frequently Asked Questions
How does Infogram make interactive maps easy to create?
Infogram’s 800+ maps and simple tools let you build dynamic maps quickly. A data journalist can create a clickable election map, while a market researcher can plot customer locations, all without design skills. Import data from spreadsheets or PDFs, and add features like tooltips or animations. It’s fast, intuitive, and needs no coding.
Where to use interactive line charts?
Line charts are useful in many different fields. Any time you want to share how different data categories performed over the same period of time, a line chart is ideal. Line charts are used in finance, science, mathematics, marketing, business, and more, and are great for creating WOW moments. A typical line chart could show the number of visitors to a site or the stock price of a company changing over time. They can display weather patterns in multiple cities in a set time frame. Line charts can illustrate consumer spending habits across multiple months. The possibilities are endless. When using interactive line charts, expect audience engagement and retention to increase.
Line charts work best when comparing a limited number of variables. If there are too many lines running across a plotted graph, the viewer can become overwhelmed and disengaged. Remember to use line charts only if you want to show how values change over time. If you want to show how values differ in different categories, consider using a column chart.
How do I create a line chart?
You can make a line chart in 5 easy steps:
- Join Infogram to make your own line chart.
- Select a line chart type (line, area, multiple axes).
- Upload or copy and paste your data.
- Customize labels, colors, and fonts.
Download your line chart or embed on your website.
What are some best practices for creating line charts?
- Start the Y-axis at zero – otherwise, your viewer might draw inaccurate conclusions.
- Clearly label your axes – make sure the viewer knows what they are comparing.
- Remove distracting chart elements – grids, varying colors, and bulky legends can distract the viewer from quickly seeing the overall trend.
- Avoid comparing more than 5 lines – you don't want your chart to become cluttered or hard to read.
- Intervals should be equal in size.
- Lines should only connect values in adjacent intervals. If data is missing, indicate it is missing.
How do I style lines in charts?
Customize chart lines to your liking – change the weight and style of the lines to make your data easier to view and emphasize specific indicators in the chart.
To customize the lines of your chart:
- After clicking on the chart you wish to customize, head over to the Color tab in the Settings panel on the right.
- Click on the gear icon next to the line you wish to customize.
- Set the weight of the line by typing it in the text box and choose the style of the line from the dropdown menu.
The same style can be used for all lines by clicking on Apply to all lines.You can also customize lines from the Edit data tab by clicking on any of the colors in the top row and then following the steps described above.
How do I create live-updating charts and maps?
With Infogram, you can create dynamic charts and maps that update live and in real-time. We support two integrations for live updates:
- Google Sheets
- JSON feeds
As soon as the data changes in the Google Sheet or JSON file, the chart or map it is linked to will automatically update, even when embedded.Note: Infogram doesn't support formulas, only raw data. If you use formulas or other scripts in your Google sheet, the calculations may not show on Infogram after the import. To create a live-updating chart or map via Google Sheets:
- In a project, click the Add chart (or Add map) button on the left side panel and choose the chart type that best fits the information you want to display. If you’re not sure which one to pick, try adding any chart type to your project and double-click it to review the example data. Use this data layout in the Google sheet you want to import into a chart. Tip: Most Infogram charts can only display numeric data (line, column, bar, pie, bubble charts, etc.). However, some are designed to display textual information as well (word cloud, treemap). If your data source contains some columns with numbers and some with text, you will need to separate textual ones and visualize them in a separate text-based chart or import the data into a table chart that supports numbers + text inside one chart.
- Double-click the chart to open its editor. Above the data table, you will see data import buttons. Choose to Add a Google Drive document.
- Connect your Google Drive account. All Google sheets will be displayed in the list. Pro tip: You can remove the Google Drive and Infogram integration via the Google account settings. When you do, existing live-updating charts will lose their connection.
- Choose the spreadsheet with the data you need from your Google Drive.
- When you edit information in your Google sheet, it will automatically update in your Infogram chart. The chart refreshes data every 30 seconds to a minute. These changes will automatically apply to your embeds and shared URL link.
Note: When changing the order of tabs in a Google sheet, the tabs will not automatically shift in your Infogram project. Each data tab of your Infogram project draws information from the numerically corresponding tab in the Google sheet, therefore you have to manually rename the tabs in your Infogram chart.To create a live-updating chart or map via a JSON feed:
- Add a chart or map to your project canvas by clicking the Add chart or Add map buttons in the left side panel.
- Double-click the chart to open its editor. Above the data table, you will see data import buttons. Choose the Add JSON feed option.
- Use this example to understand how to format your JSON feed. To create a multi-tab chart or map, use the following example.
- Now, when you edit the information in your JSON feed, it will automatically update in your Infogram chart. The chart refreshes data every 30 seconds to a minute. These changes will automatically apply to your embeds and shared URL link.
How do I adjust the chart axis?
Infogram offers a variety of settings for customizing charts and displaying your data, such as adjusting the chart axis, enabling a zero baseline, adjusting your line chart, as well as tailoring the data format.
By default, charts automatically assign an axis range starting from zero and going up to the maximum value. If your data values are large, it might be hard to compare the differences between elements. Having the axis starting point from a different value will make the distinctions between elements more obvious.
Click on the chart to select it, then expand the Axis & Grid tab in the right sidebar.
Enter the axis start and/or end values to adjust the axis range.
You can also add labels to the axes and enable or disable gridlines in the chart background. Grids can make your data easier to follow, but can also be distracting in some situations. Use grids if the value of each specific data point is important.
Enabling the Fixed grid in all sheets settings will lock the range of the chart axis across all data sheets in your chart based on the largest value in the whole dataset. Use this setting if you are, for example, comparing the same elements over a period of time and intend to have the user click on the tabs above your chart to compare the data and see how it has changed. This way, the increase or decrease in values will be clearly visible as the axis range will not change. Don’t use this setting if you are comparing different elements in the tabs or the chart visualization will differ significantly.
Didn't find the answer? Check our FAQs

Try Infogram Now!
Are you ready to unleash the power of data visualization? Get started with Infogram today and create stunning, interactive content that captivates your audience. Elevate your projects and bring data to life.