16.02.2024 by Infogram
In marketing, capturing attention is key. However, with more information surrounding us than ever before, it’s getting extremely difficult to really captivate and inspire. That’s where visual content comes in. And visuals complemented with stunning data visualizations and impactful storytelling form a marketing infographic – proven to significantly enhance information retention.
Infographics for marketing combine information and visuals to achieve engaging content, and according to the NN Group, infographics receive more likes and shares on social media than any other form of content. This and other research on infographics make it clear that incorporating infographics into content marketing strategies is a key part of success. But how do you create stunning marketing infographics, promote them, and measure their success?
In this comprehensive guide, we’ll answer these and other questions on marketing infographics. We’ll explore their significance, planning strategies, design principles, and effective promotion techniques. Without further ado, let’s dive right in!
Click to jump ahead:
- Why use an infographic for marketing?
- How to plan your marketing infographic
- How to create compelling content for a marketing infographic
- Key design principles for impactful infographics
- Infogram for creating marketing infographics
- Optimizing infographics for SEO
- Promote your infographics
- Measure success and analyze performance
- Good marketing infographic examples
- Common mistakes to avoid
- Future trends in marketing infographics

Why use an infographic for marketing?
Before we explore how to create a marketing infographic, let’s first list a few benefits of using them.
Capture attention
It’s no secret – the average attention span is shrinking. This makes it crucial for marketers to convey information quickly. Infographics cut through the clutter, delivering messages in a visually appealing format that captivates audiences. Ultimately, infographics serve as a concise and engaging tool, allowing brands to communicate complex ideas with efficiency, ensuring their messages leave a lasting impact on the audience.
Enhance information retention
Studies show that people remember visual content better than text alone. Infographics leverage the power of visual memory, making it easier for your audience to recall and comprehend your message. By using a combination of images, charts, and data visualizations, infographics can be an effective tool to convey complex information in a simplified and engaging manner.
Increase social media engagement
Social media platforms thrive on visually appealing content. To stand out in the crowded social media space, it’s crucial to create content that grabs the attention of your potential customers. That’s where infographics come in. They’re highly shareable, boosting engagement and extending the reach of your marketing message across various online channels. As a result, they can help businesses to increase brand awareness, and drive traffic to their website.
SEO benefits
Search engines favor content that engages users. Infographics can increase dwell time on your website, reduce bounce rates, and earn valuable backlinks, positively impacting your SEO efforts. Also, incorporating relevant keywords in your content improves its visibility on search engines, improving the chances of reaching a wider audience. Consistently updating and optimizing your website’s content not only attracts and retains visitors but also signals to search engines that your site is active and relevant.

How to plan your marketing infographic
Now let’s dive into the process of creating an infographic – starting with 4 steps of planning your digital marketing infographic.
1. Identify your target audience
The first step to creating an impactful marketing infographic is understanding your audience. Tailor your content to resonate with the interests and preferences of your target demographic. To do that, research your target audience thoroughly by analyzing demographics, interests, and online behavior. Use tools like analytics and surveys to gain insights into their preferences. This understanding will help you create content that not only captures their attention but also resonates with their needs and preferences.
2. Define your message and objective
Another important aspect is clearly articulating the purpose of your infographic. Whether explaining a complex process, presenting data, or telling a story, a well-defined objective will guide your design and content choices. In defining your message and objective, be specific about the action you want your audience to take after seeing the infographic. Whether it’s promoting a product, raising awareness, or educating a clear objective ensures that your infographic serves a purpose and adds value to your audience.
3. Choose the right data and information
Selecting data points that are relevant and support your message is crucial. Focus on key information to avoid overwhelming your audience with excessive details. When selecting data and information, prioritize quality over quantity. Ensure that the data you include is accurate, up-to-date, and directly supports your message. Also, consider how you craft your narrative – it needs to flow logically, guiding your audience through the information in a meaningful way. This approach helps maintain engagement and ensures that your audience gains valuable insights.
4. Select a design style
Lastly, consider the aesthetics that align with your brand identity. Choosing the right design style is crucial in enhancing the visual appeal of your infographic. Align the color scheme, fonts, and overall aesthetics with your brand guidelines. A visually appealing design not only captures attention but also contributes to the overall user experience. Balance creativity with professionalism to create an infographic that is visually appealing and effectively conveys your message.
How to create compelling content for a marketing infographic
When creating an infographic, you need to make sure your infographic is not only visually appealing but also holds attention with impactful messaging and storytelling. Here are a few factors to consider if you want to create compelling content for your digital marketing infographic:
Simplify complex information
Simplifying complex information is crucial for ensuring that your audience understands the content effortlessly. Break down complex data into clear and concise sections, and leverage visual elements such as icons and illustrations to improve comprehension. By simplifying complex information, you make your infographic accessible to a broader audience.

Use storytelling techniques
Tell a story with your infographic. Integrate storytelling techniques to add a narrative layer to your infographic. Craft a compelling storyline that flows logically, capturing the audience’s attention and guiding them through the information. Storytelling not only makes your content more engaging but also aids in better retention, as people tend to remember information presented in a narrative format.
Incorporate statistics and data visualizations
Incorporating statistics and data visualizations is essential for providing evidence and supporting your key points. Make sure to use charts, graphs, and other visual elements to present data in a visually appealing and easy-to-understand manner. Infographics that include relevant statistics not only improve credibility but also serve as compelling sources of information for your audience.
Maintain brand consistency
Infographics are an extension of your brand. Maintaining brand consistency is key to reinforcing your brand identity. Ensure that your infographic aligns with your established color schemes, fonts, and logo placement. Consistent branding across all your materials, including infographics, helps in building a recognizable and trustworthy image for your audience. Moreover, it reinforces the connection between the infographic content and your brand, creating a sense of familiarity.
Key design principles for impactful infographics
Choose colors wisely
When choosing colors for your infographic, consider the emotions and associations they evoke. Different colors can convey specific meanings, so select a palette that not only aligns with your brand but also complements the overall message of your infographic. For example, warm colors may evoke feelings of energy and excitement, while cooler tones might convey a sense of calm and professionalism.
Select appropriate fonts and typography
Selecting appropriate fonts and typography is essential for readability. Opt for clear and legible typefaces, especially when the infographic is scaled down for online sharing. Consistency in font styles contributes to a cohesive design, ensuring that your audience can easily consume and understand the information presented.
Ensure visual hierarchy
To make sure your infographic is easy to read, ensure a clear visual hierarchy to guide the viewer’s eye through the content. You can emphasize key points using variations in size, color, and placement. This hierarchy helps your audience prioritize information and understand the infographic’s main message more effectively.
Incorporate engaging images and icons
Incorporate engaging images and icons that align with your content and improve the overall design look. Visual elements not only add interest but also help in conveying complex information more intuitively. Choose images and icons that complement your brand and reinforce the message you want to communicate.
Emphasize simplicity and clarity
To avoid overwhelming your audience with visual clutter, make sure to emphasize simplicity and clarity in your infographic design. A clean and well-organized layout ensures that viewers can quickly grasp the main points without feeling overwhelmed. Also, prioritize clarity to improve the overall user experience and make your infographic more effective in communicating information.
Infogram for creating marketing infographics
Infogram is an intuitive and feature-rich online tool designed to simplify the process of creating infographics. With its user-friendly interface and a vast library of templates, charts, and icons, Infogram enables marketers to transform raw data into visually striking graphics without the need for advanced design skills. Let’s explore some of the key features of Infogram:
User-friendly tool
Infogram has a straightforward drag-and-drop interface, making it accessible to users with varying levels of design knowledge. The platform’s intuitive layout allows you to focus on content creation rather than dealing with complicated design tools.
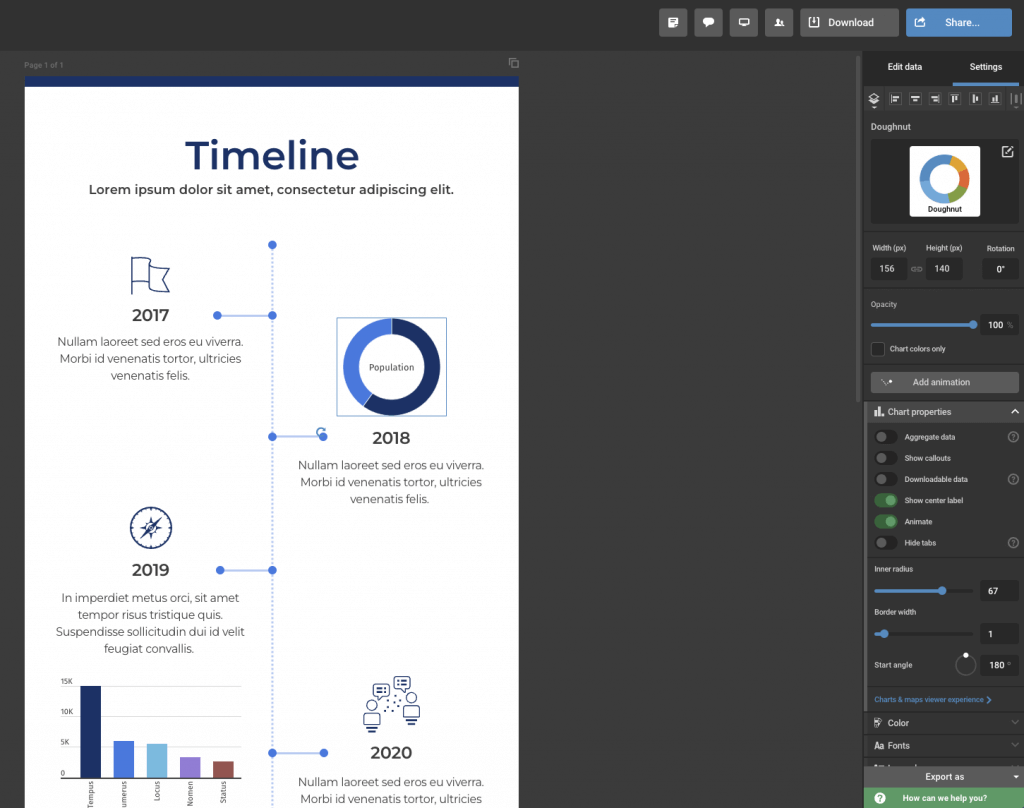
Customizable charts and graphs
Effective infographics often rely on compelling data visualizations. Luckily, Infogram offers a wide range of customizable charts and graphs, allowing you to present data in a visually appealing and easily digestible format. From pie charts to interactive maps, the possibilities are extensive.

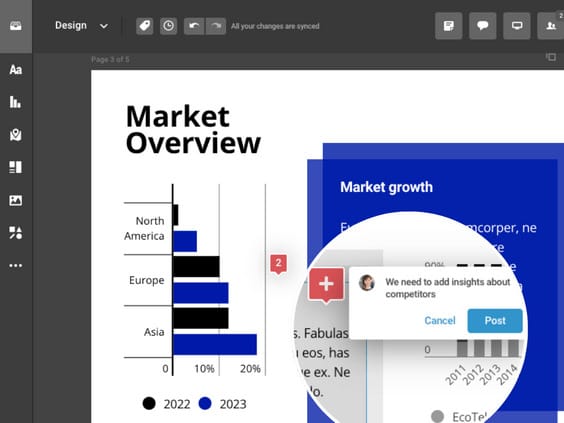
Real-time collaboration
Collaboration is streamlined on Infogram, as teams can work on projects in real time. This feature is particularly valuable for marketing teams working across different locations, ensuring seamless coordination and timely project completion.
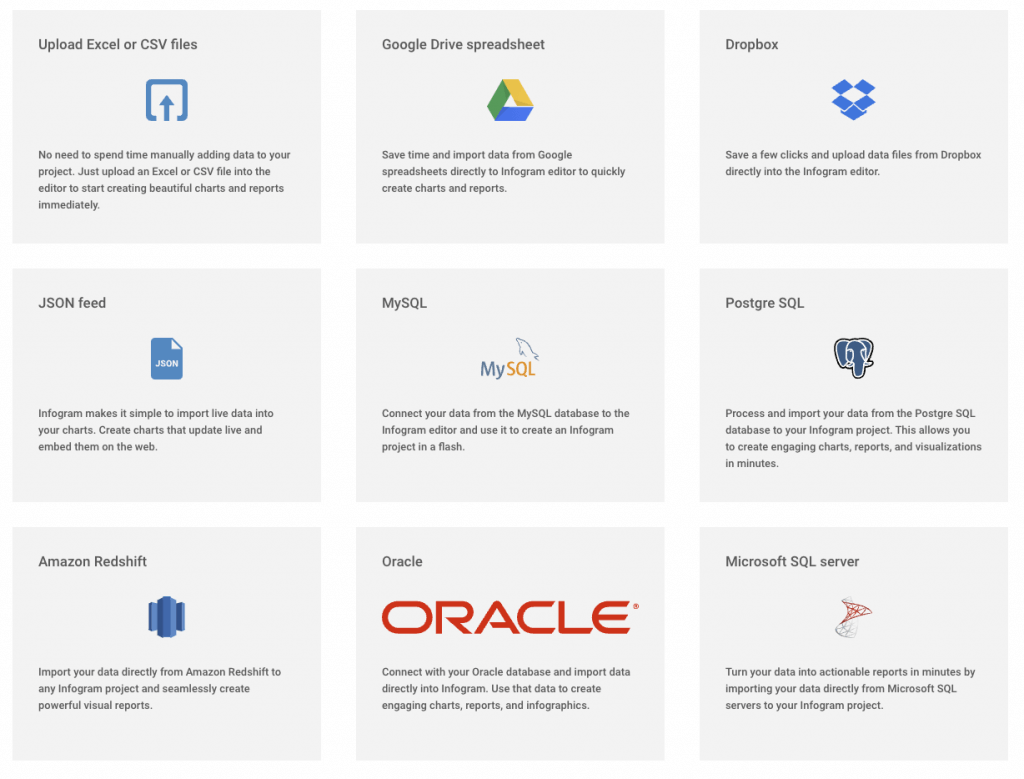
Integration capabilities
Infogram integrates seamlessly with popular tools like Google Sheets and Microsoft Excel, making it easy to import data directly into your infographics. This feature saves time and ensures data accuracy and consistency across various platforms.
Ultimately, Infogram stands out as a key resource for marketers wanting to elevate their content marketing efforts through visually appealing and informative infographics. With its user-friendly interface and robust customization options, Infogram empowers marketers to transform data into compelling visual narratives that captivate audiences and drive engagement. Incorporate this versatile tool into your marketing arsenal to discover the potential of visual storytelling in the digital landscape.
Optimizing marketing infographics for SEO
As you’re creating your marketing infographic, don’t make the mistake of forgetting to optimize it for SEO. By optimizing your infographics, you can improve their visibility and ultimately drive more traffic to your website. Explore ways to optimize your marketing infographics:
Write SEO-friendly captions and descriptions
Write SEO-friendly captions and descriptions to optimize the discoverability of your infographics. Incorporate relevant keywords that align with the content, making it easier for search engines to index and rank your infographic. The strategic use of keywords in captions and descriptions enhances the overall SEO performance, potentially driving more organic traffic to your content.
Use Alt Text for images
Improve accessibility by incorporating descriptive alt text for images within your infographics. Alt text not only improves the accessibility of your content for individuals with visual impairments but also provides search engines with valuable information about the images. This practice contributes to better SEO rankings and ensures a wider audience can engage with your infographic.
Embed infographics on your website and blog
Increase the visibility of your infographics by embedding them directly into your website and blog posts. This not only enhances the user experience but also encourages organic sharing. When visitors find your infographic valuable and share-worthy, the embedded format facilitates easy sharing across various online platforms, increasing the reach and impact of your content.
And sharing your infographics just got even easier. If you’re creating content within WoodWing Studio, you can now enjoy a seamless data visualization and design project implementation into your content with Infogram integration. With a simple click, you can effortlessly create interactive charts, graphs, tables, and maps without the need to switch between the tools. Learn more here!

Promote your infographics
With your project ready to publish, consider the following infographic marketing tips on how to best promote your infographics, boosting their visibility and impact.
Leverage social media platforms
Promote social sharing by adding social media buttons to your infographics when embedded on your website. Encourage viewers to share the content on platforms like Facebook, X, and LinkedIn, amplifying its reach. Social sharing not only drives more traffic to your website but also enhances the likelihood of your infographic gaining traction within relevant online communities.

Email marketing integration
Incorporate infographics into your email marketing campaigns to improve engagement with your subscribers. Embed visually appealing snippets or provide clickable thumbnails that link to the full infographic. This not only adds a dynamic element to your emails but also offers valuable content directly to your audience’s inbox, increasing the likelihood of interaction and sharing.
Collaborate with influencers and partners
Broaden the reach of your infographics by collaborating with influencers or partnering with other businesses in your industry. Influencers can share your infographics with their dedicated audience, tapping into their credibility and expanding your content’s exposure. Establishing partnerships allows you to leverage each other’s networks, fostering a mutually beneficial exchange of valuable content.
Use paid advertising
Boost the visibility of your infographics through targeted paid advertising on platforms like Instagram or Facebook. Create visually appealing ads that showcase key elements of your infographic and target specific demographics relevant to your content. Paid advertising provides a strategic avenue to reach a larger audience, driving traffic to your website and increasing the overall impact of your infographic campaign. Additionally, consider using paid social media promotions to amplify further the reach of your infographics within specific user segments.
Measure success and analyze performance
In marketing, it’s important to track progress and analyze performance. Here are a few ways you can measure success with infographics.
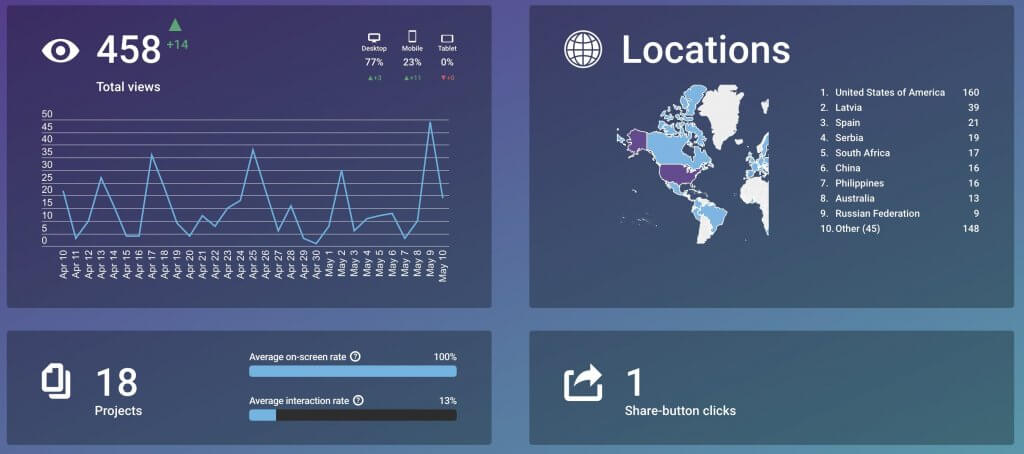
Use Infogram content engagement analytics
Infogram allows users to track key engagement metrics directly within the platform. You can monitor metrics such as views, clicks, and interactions, providing a comprehensive overview of how your infographics are performing. This data is crucial for understanding audience behavior and identifying trends over time. To access engagement analytics, check out team and enterprise plans.
Track engagement metrics
Regularly monitor engagement metrics such as likes, shares, and comments on social media platforms to assess the performance of your infographics. These metrics offer valuable insights into audience interaction and can help you gauge the level of resonance your content has within your target audience. Use this data to refine your future infographic strategies and tailor content to better meet the preferences of your audience.
Analyze social shares and backlinks
Use analytics tools to track social shares and backlinks associated with your infographics. Social shares indicate the extent to which your content is being shared across various platforms, providing a measure of its virality. Backlinks, on the other hand, contribute to your website’s SEO and domain authority. Analyzing these metrics helps you understand the reach and impact of your infographics, allowing for informed adjustments and improvements to your content strategy.
Gather feedback and make improvements
Actively seek feedback from your audience through surveys, comments, and direct interactions. Analyze this feedback alongside the data from your analytics tools to identify areas for improvement. Understanding how your audience perceives and interacts with your infographics allows you to make informed adjustments. Continuously refine your infographic strategy based on this feedback, ensuring that your content remains relevant, engaging, and aligned with the evolving preferences of your audience.
Good marketing infographic examples
Creating a marketing infographic is easier said than done. What helps, is to look at good marketing infographic examples to get inspired and recognize certain characteristics and elements that make an infographic effective and visually appealing. Here are a few marketing infographic examples to consider:
The World Blood Donor Day infographic
The World Blood Donor Day infographic is a great example of a visually appealing and informative infographic that aims to educate and attract people’s attention. The visual elements are closely related to the topic and capture attention with animations and interactive characteristics.
Valentine’s Day infographic
If you’d like to create an infographic about a specific holiday or celebration, this Valentine’s Day infographic serves as a great example. Combining data visualizations, images, videos, and visual elements, you can create a highly engaging infographic just like this one.
Valuable brands infographic
This infographic showcases the BrandZ ranking results in a simple yet highly engaging and interactive way. The use of different charts and graphs makes this infographic highly informative while entertaining to view and interact with.
Nobel Prize infographic
This infographic shines a light on women who are Nobel Prize laureates and winners. What’s great about it is that it features an interactive world map, where you can discover more information about the Nobel laureates while hovering over different regions of the world. This makes the infographic highly interactive and engaging.
Discover more captivating examples of infographics and other projects on our examples page!
Common mistakes to avoid
Now that you know what a good infographic looks like, it’s also important to recognize what a bad infographic design could look like. To help you avoid common mistakes that can compromise your infographic design, consider the following tips:
Overcrowding with information
Try not to overload your infographics with excessive information. Prioritize clarity and conciseness to ensure that your audience can easily grasp the main points. Use a hierarchy in presenting information, emphasizing key details and avoiding unnecessary clutter. A well-organized design with a focus on essential information enhances the overall user experience and encourages engagement.
Not optimizing for mobile
Our everyday life is largely dominated by mobile devices, so it’s crucial to optimize your infographics for mobile viewing. Ensure that your content is responsive and adjusts seamlessly to different screen sizes. A mobile-friendly design enhances accessibility and accommodates users who consume content on smartphones or tablets. Neglecting mobile optimization could result in a suboptimal user experience and a potential loss of audience engagement.
Neglecting branding elements
Maintaining consistency with your brand is key to reinforcing recognition and trust. Incorporate branding elements such as logo placement, color schemes, and fonts to align your infographics with your overall brand identity. Consistent branding not only enhances visual appeal but also contributes to building a strong and memorable brand image, fostering a sense of reliability among your audience.
Failing to keep the information updated
Regularly update your infographics to reflect the latest data and maintain relevance. Outdated information can lead to misinformation and negatively impact your credibility. Schedule periodic reviews of your infographics to ensure that statistics, facts, and any time-sensitive information are up-to-date. By staying current, your infographics remain reliable sources of information and continue to serve as valuable assets for your audience.
Future trends in marketing infographics
Finally, it’s important to consider that the data visualization field continues to evolve at a rapid pace. That’s why it’s crucial to stay ahead of the trends and make sure you’re creating content that people are currently enjoying and looking for. Here are the main 3 trends in marketing infographics, and make sure to learn about the data visualization trends of 2024.
Interactive infographics
Embrace the rising trend of interactive infographics, which enable users to engage with content in dynamic and personalized ways. Interactive elements such as clickable buttons, hover effects, and animated transitions can turn static information into an immersive experience. This approach not only enhances user engagement but also encourages active exploration, making the learning process more interactive and memorable.
Incorporating video and animation
Discover how integrating video and animations can take your infographics to the next level. Videos and animated elements bring a dynamic aspect to your content, making it more visually appealing and captivating. Whether it’s explaining a process, showcasing a product, or adding visual interest, incorporating multimedia elements adds depth to your infographics, increasing the likelihood of capturing and retaining your audience’s attention.

Personalized and customizable infographics
Explore personalized infographics to improve user engagement and connection. Tailoring content to individual preferences can be achieved through interactive features that allow users to customize the information they receive. This level of personalization not only increases relevance but also fosters a sense of connection between the audience and the content, making the overall experience more meaningful and impactful. Consider incorporating options for users to choose specific data points, themes, or visual styles to create a truly personalized experience.
Conclusion
In conclusion, this comprehensive guide serves as a roadmap for any marketer who’s trying to plan, create, promote, and optimize marketing infographics. From the strategic planning stages to the optimization for SEO and the embracing of emerging trends, mastering the art of marketing infographics is key to standing out in the competitive digital marketing field. Armed with these insights, you can truly captivate audiences, drive engagement, and achieve lasting success in your content marketing endeavors with the use of infographics. And with Infogram, it’s easier than ever before. Try it now!
Get data visualization tips every week:
New features, special offers, and exciting news about the world of data visualization.