08.03.2016 by Infogram
Metrics and analytics are important to businesses and marketers, but you shouldn’t use the two terms interchangeably. We understand this can be confusing, as the two are so closely related. But, you can’t have analytics without metrics, and metrics alone won’t help you take action, understand what is going on, or help you improve results.
Let’s go over the difference between metrics and analytics, the key metrics you should watch, and the right analytics questions to ask when evaluating the effectiveness of your campaigns.
Metrics vs. Analytics
Think of metrics as the ‘what,’ and analytics as the ‘so what?’ Metrics are the numbers you track, and analytics implies analyses and decision making.
Metrics: What you measure to gauge performance or progress within a company or organization. Your most important metrics are your key performance indicators, or KPIs.
Analytics: Analytics use metrics to help you make decisions about how to move forward.
If your marketing organization is looking to develop a sophisticated metrics and analytics system of its own, you need these essential platforms to begin measuring and adjusting impact.
- Analytics platform
- Marketing automation platform
- Social media measurement platform

What Metrics Should You Track?
The metrics you track need to be relevant and actionable. Focus on the metrics that are closely associated with objectives you’ve formed at different stages of the funnel. Different parts of the funnel demand different metrics to measure their goals, and these key metrics vary from company to company.
Successful marketers need to ultimately drive revenue, which is why its so important for you to understand the metrics that matter, track, analyze, and report on them. We’ve broken down the funnel into two sections – upper and lower – and explained relevant metrics for each phase.
Upper levels of the funnel are all about reach, awareness, and brand perception:
- Awareness
- Branded search
- Brand recall
- Website traffic
- Page views, pages per visit, and time spent on site
- Targeted engagement
- Bounce rate
- Inbound links
Lower levels of the funnel look at lead nurturing, conversion, and revenue:
- Quality of leads
- Cost per lead
- Website form fonversion rate
- Marketing qualified leads (MQL)
- Sales qualified leads (SQL)
- Pipeline contribution
- Revenue – ROI
- Retention rate
- Customer lifetime value (CLV)
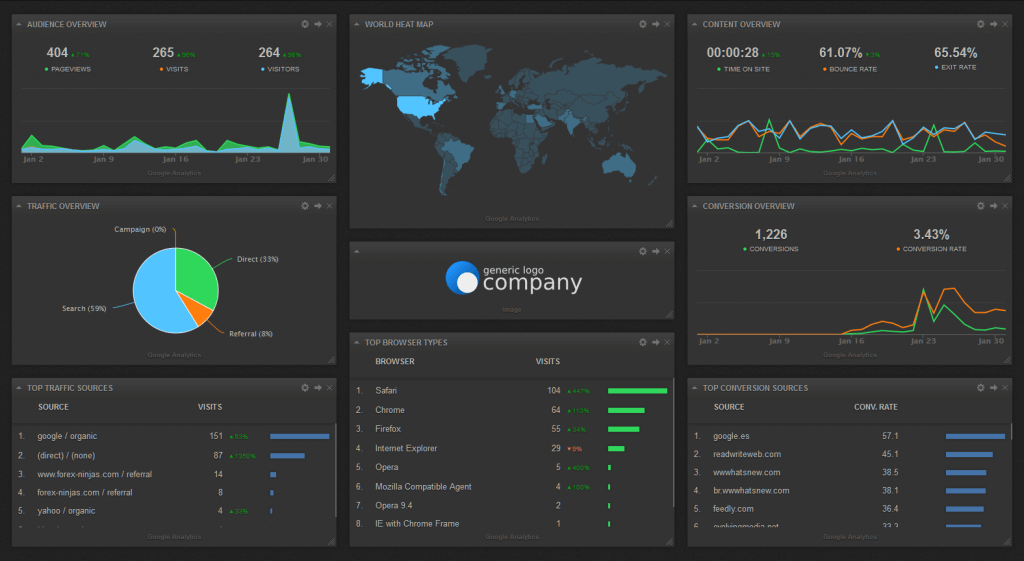
A metrics dashboard is a visual representation of your data, giving you a quick and easy way to view your company’s performance in real-time. They combine all of your important information in one place, which saves you time and money.
Ask Yourself These Questions:
Even with the best software and the best metrics (KPIs) you still need smart people to interpret what the numbers mean. Analytics is the investigation into the numbers, and you need to make sure you are asking the right questions.
- Am I making the best use of my money?
- How can we best acquire new customers?
- How are my awareness and brand building programs performing today? This month? This quarter?
- How can I improve them for next quarter? next year?
- What new products should we develop?
- Which channels create the greatest response rate?
- Should I shift money spend on media and advertising?
- Which new markets should we pursue?
- What other branding programs can help boost prospects towards the bottom of the funnel?
Once you have asked yourself these questions, we suggest you combine your findings in a report to share with your co-workers! If you want to bring your data to life, Infogram is a great online tool for creating charts that enhance internal reports and presentations. Reports make sure everyone is on the same page, making the decision making process faster and more effective.
Why are Metrics and Analytics Important?
Consumers are more knowledgable than ever and have taken control of their purchases. Marketers have become more involved in all stages of the buyer’s journey. It’s important for marketers to be able to prove the value of their spend from awareness to revenue.
Marketers can now confidently report on the ROI of their programs or see where improvement is needed. The reality is that a data-driven marketing approach is key to driving revenue growth.
Metrics and analytics, when used properly and on a regular basis, can have a powerful impact on a company’s overall success – not just on its marketing efforts. The two are essential for marketers because they show the value of your efforts, help you align your goals, and let you effectively address the funnel from top to bottom.
If you want to create dashboards and reports that include your logo, fonts and colors -reach out to us! We are always on hand to show you how.
Get data visualization tips every week:
New features, special offers, and exciting news about the world of data visualization.
