25.02.2016 by Anete Ezera
Today’s consumers have grown tired of traditional advertising pitches and gimmicks. Due to increased internet use and the prevalence of online and mobile advertising, consumers are more educated and more weary. The result? Marketers are being forced to adapt – and data visualizations can help.
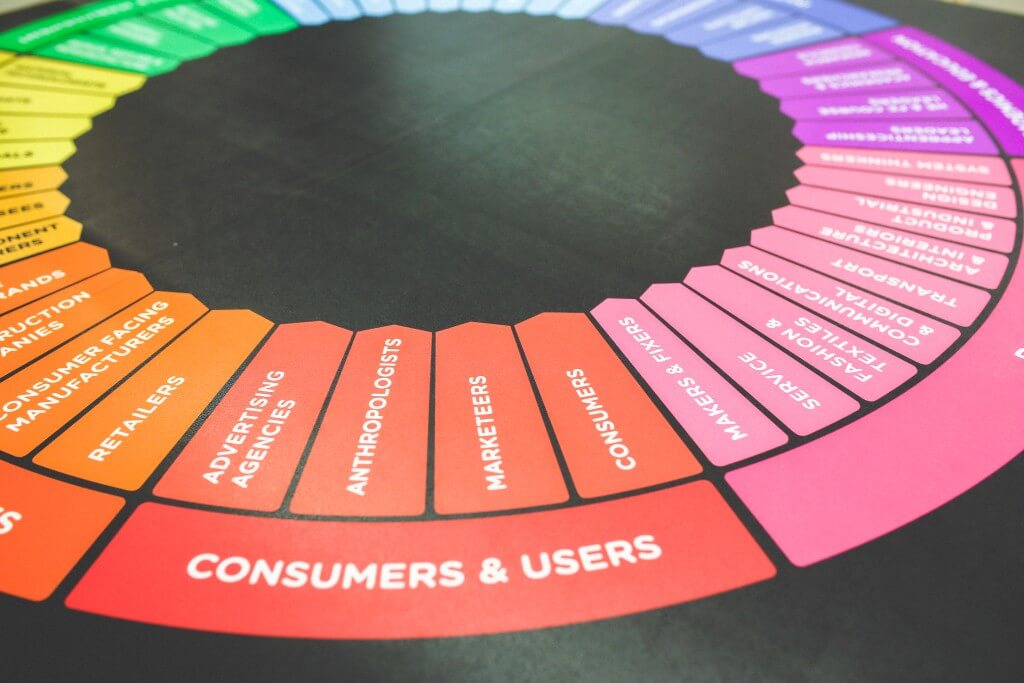
Data visualizations are quickly invading our digital world as technology advances, making data easier to collect, and more available than ever before. Chances are data already drives part of your brand strategy, or is destined to play an important role.
Visuals > Text
According to a study from the Nielsen Norman Group, people read at most 28% of the words on a webpage during an average visit, but 20% is more likely. Scanning text is an extremely common behavior for today’s viewers. What would people rather see? Visuals!
Data visualizations can display complex data sets and processes or create beautiful, innovative methods for presenting statistical data. Dataviz helps you show data and information in an engaging way that leads to understanding among your customers and ultimately insight into your product or service.
Feel free to spice up your marketing materials with charts, graphs, infographics, and facts. Prove to your audience that you add value by sharing customer satisfaction data, product ratings, reviews, and testimonials. Want more proof? Here are 13 reasons why our brains crave infographics.
Should You Use Data in Your Marketing?
When used properly, data can help marketers identify, win over, and serve customers better. Marketers know more about audience behaviors and demographics than ever before, allowing for more targeted, relevant marketing efforts.
Before you incorporate data into your strategy, ask yourself these 5 questions:
- How effective is your current marketing strategy and how easy is it to find and add the right data?
- What is the right data you need to help grow your business?
- What data can you extract to wow customers and gain a competitive edge?
- Can you find the 80/20 analytics that matter? – Just 20% of your customers often generate about 80% of your company’s top-line revenue, so make sure you are targeting your super-fans.
- How ethical and transparent is your company’s data collection?
If you’ve gathered customer testimonials and people are really loving your product or service, share that! If you conducted a product quality review, and you came out on top, share it! If you stumbled across a recent study that supports the need for your product or service, you guessed it – share it!
Catching up with Technology
Marketers and advertisers are constantly looking for new ways to stand out, create compelling content, and drive engagement. The problem is that people are more tech-savvy than ever, living out their lives in HD across multiple devices and platforms on a daily basis.

We are constantly overloaded by content and information. And thanks to technology, we are obsessed with personalized data that helps explain the human experience and enhance our lives. We have sleep, step, and calorie trackers. We speak in 140 characters online. And we want to know companies have us in mind, specifically, when they market their product or service.
By conveying your data-driven message in a visually appealing way, you can make people more likely to believe you, show their support, and move towards the bottom of the sales funnel.
How Data Guides Today’s Marketers
A global review of data-driven marketing surveyed 3,000 marketing professionals and found that nearly all recognize the importance of data in advertising and customer experience efforts, with over 77 percent saying they’re confident in the practice and its prospects for future growth.

Marketers rely on data internally to make adjustments to campaigns, track success on social media, view website analytics, and share information with coworkers. In many cases, brands are sitting on a lot of data that could potentially attract people to their business.
Metrics have always helped businesses and marketers make decisions, but the process of consolidating those metrics took time. But, metrics don’t take forever to gather and analyze anymore, and this speed increase has changed the marketing landscape. Data can now be quickly visualized and repurposed for external use, helping drive sales.
Well placed data visualizations lead to better engagement with customers, more awareness for the brand, and more revenue for your company. Combine brand-driven data visualizations with valuable content and you have a winning sales pitch.
If you have data you want to visualize, and aren’t sure where to start, online tools like Infogram make it easy to create charts and graphs that make an impact. Try out our product for free or set up a time to speak with an Infogram specialist to see if Infogram is right for you and your company.

Get data visualization tips every week:
New features, special offers, and exciting news about the world of data visualization.