23.11.2016 by Infogram
Imagine stepping into a three-dimensional data visualizations that lets you fully interact with the data. This is now possible thanks to virtual reality technology.
Virtual reality data visualizations are computer generated, highly interactive, 3D projects. While the concept of VR isn’t new, the idea of immersive data exploration most certainly is – and the exciting possibilities are endless.
VR visualizations have the potential to offer easier pattern recognition and retention. They also feature different perspectives beyond the two-dimensional images we are familiar with. Let’s take a look at 8 amazing data visualizations in virtual reality:
1) Brexit – Google Labs
The United Kingdom voting on whether to stay in the European Union or to “Brexit” was a huge story across Europe. Google Labs decided to make an interactive guide to the UK’s EU referendum. They created a VR visualization which simply illustrates the top questions asked in each country on search.
2) Blue Whale Experience – Fusion
The blue whale is the largest animal on the planet. Simon Ducroquet and the Interactive Team at Fusion wanted to show what it would be like to swim around a blue whale, breaking down its complex anatomy and behavior. Click here to view a full step-by-step layout of the design process.
3) Titans of Space – Oculus Rift DK2
Titans of Space 2.0 is a deep-dive tour through our Solar System. The goal was to gain a new perspective on what our universe actually looks like by taking advantage of the increased spatial awareness made possible by modern VR. You can feel how big our planets actually are!
4) 21 years of the Nasdaq – Wall Street Journal
The Wall Street Journal crafted a virtual reality guided tour of 21 years of the Nasdaq. The width of the path reflects the index’s price/earnings ratio, with a narrower path reflecting higher share prices relative to earnings.
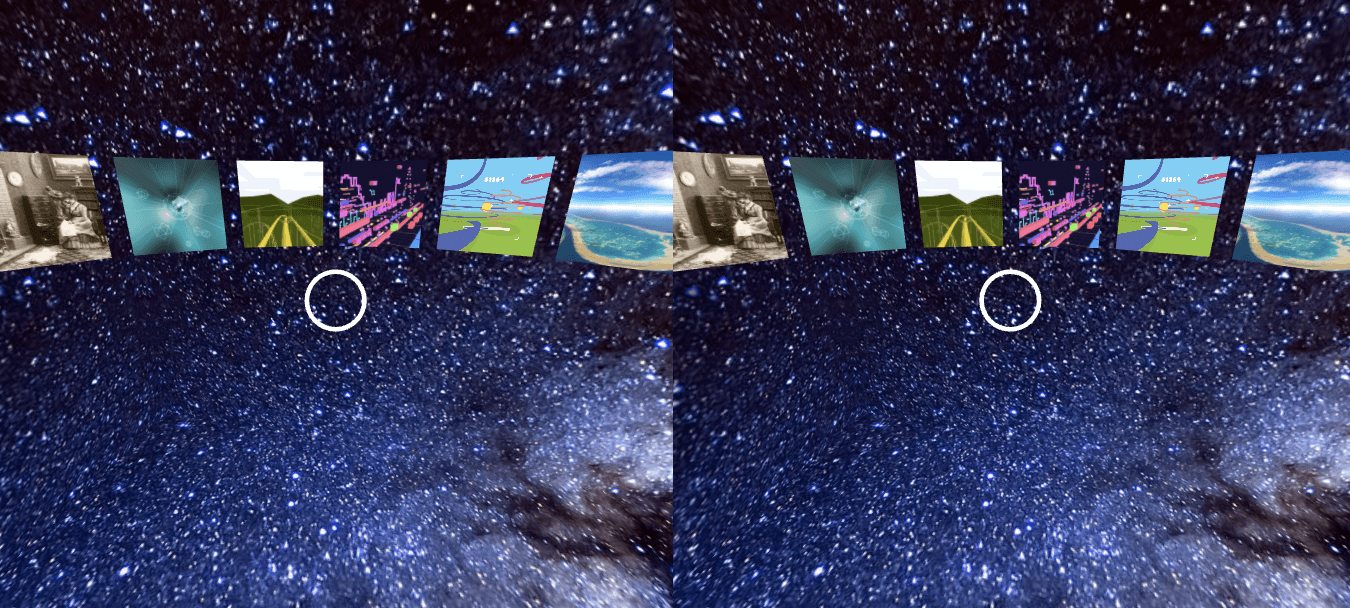
5) Google Chrome Experiments
Turn your smartphone into a virtual reality device using Google Chrome and Cardboard. Pick one of the images to go on a crazy adventure. You can ride a roller coaster, explore an animated bar chart, or hop on a helicopter to the Great Barrier Reef. Click the image below to see for yourself!
6) Canadian Open Data – Nirvaniq Labs
Alyssum is a virtual reality application for interactive data visualization. It provides a more insightful perspective of your data by allowing you to visualize it and interact with it in a 3D environment. Check out Nirvaniq Labs’ fun visualization of Canadian data.
7) Solitary Confinement – The Guardian
What’s it like to spend 23 hours a day in a cell measuring 6×9 feet for days, weeks, months or even years? 6×9 is the Guardian’s first virtual reality experience, which places you inside a US solitary confinement prison cell and tells the story of the psychological damage that can ensue from isolation.
8) Seeking Pluto’s Frigid Heart – New York Times
Seeking Pluto’s Frigid Heart is a stereoscopic VR experience from the New York Times that brings viewers to Pluto. Watch the New Horizons spacecraft zoom through space, soar over rugged mountains and bright plains, and stand on Pluto’s unique surface as its largest moon hovers over the horizon.
As you can see, virtual data experiences have started popping up everywhere. If you love stories about data visualization and want to read the latest news and trends, sign up for Infogram’s weekly newsletter.
Get data visualization tips every week:
New features, special offers, and exciting news about the world of data visualization.