29.05.2025 by Infogram
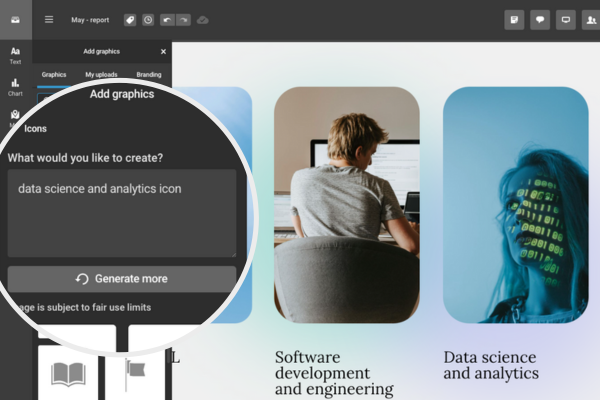
We’re excited to introduce a powerful new feature in Infogram: AI-generated icons. Whether you’re working on a dashboard, infographic, slide deck, or report, you can now generate custom icons simply by typing a description.
No need to scroll through endless icon libraries – just describe what you’re looking for, like “growth arrow with dollar sign” or “eco-friendly energy bulb,” and Infogram’s AI will create a one-of-a-kind icon that visually communicates your exact idea.

How It Helps You
Visuals play a key role in storytelling – but finding the right icon can be frustrating. Sometimes the perfect icon doesn’t exist, or you end up settling for something “close enough.” This new feature solves that problem.
With AI-generated icons, you can:
- Save time by skipping long searches through generic icon sets.
- Create visuals that are 100% unique to your story, idea, or message.
- Match your brand voice, tone, or theme more precisely.
- Turn abstract concepts into visuals that connect with your audience.
This isn’t just about speed – it’s about control and creativity. Now, you can visually express ideas that previously had no icon representation.
- For writers and researchers: Quickly create visuals to support your story – whether you’re illustrating concepts, tagging sections, or simplifying ideas. No design skills needed.
- For designers: Skip stock icon libraries and generate exactly what you want, when you want it. Keep everything aligned with your brand’s voice and aesthetic.
- For managers and analysts: Add clarity and meaning to your visuals with icons that reinforce KPIs, categories, or team updates – without disrupting your workflow.

How It Works
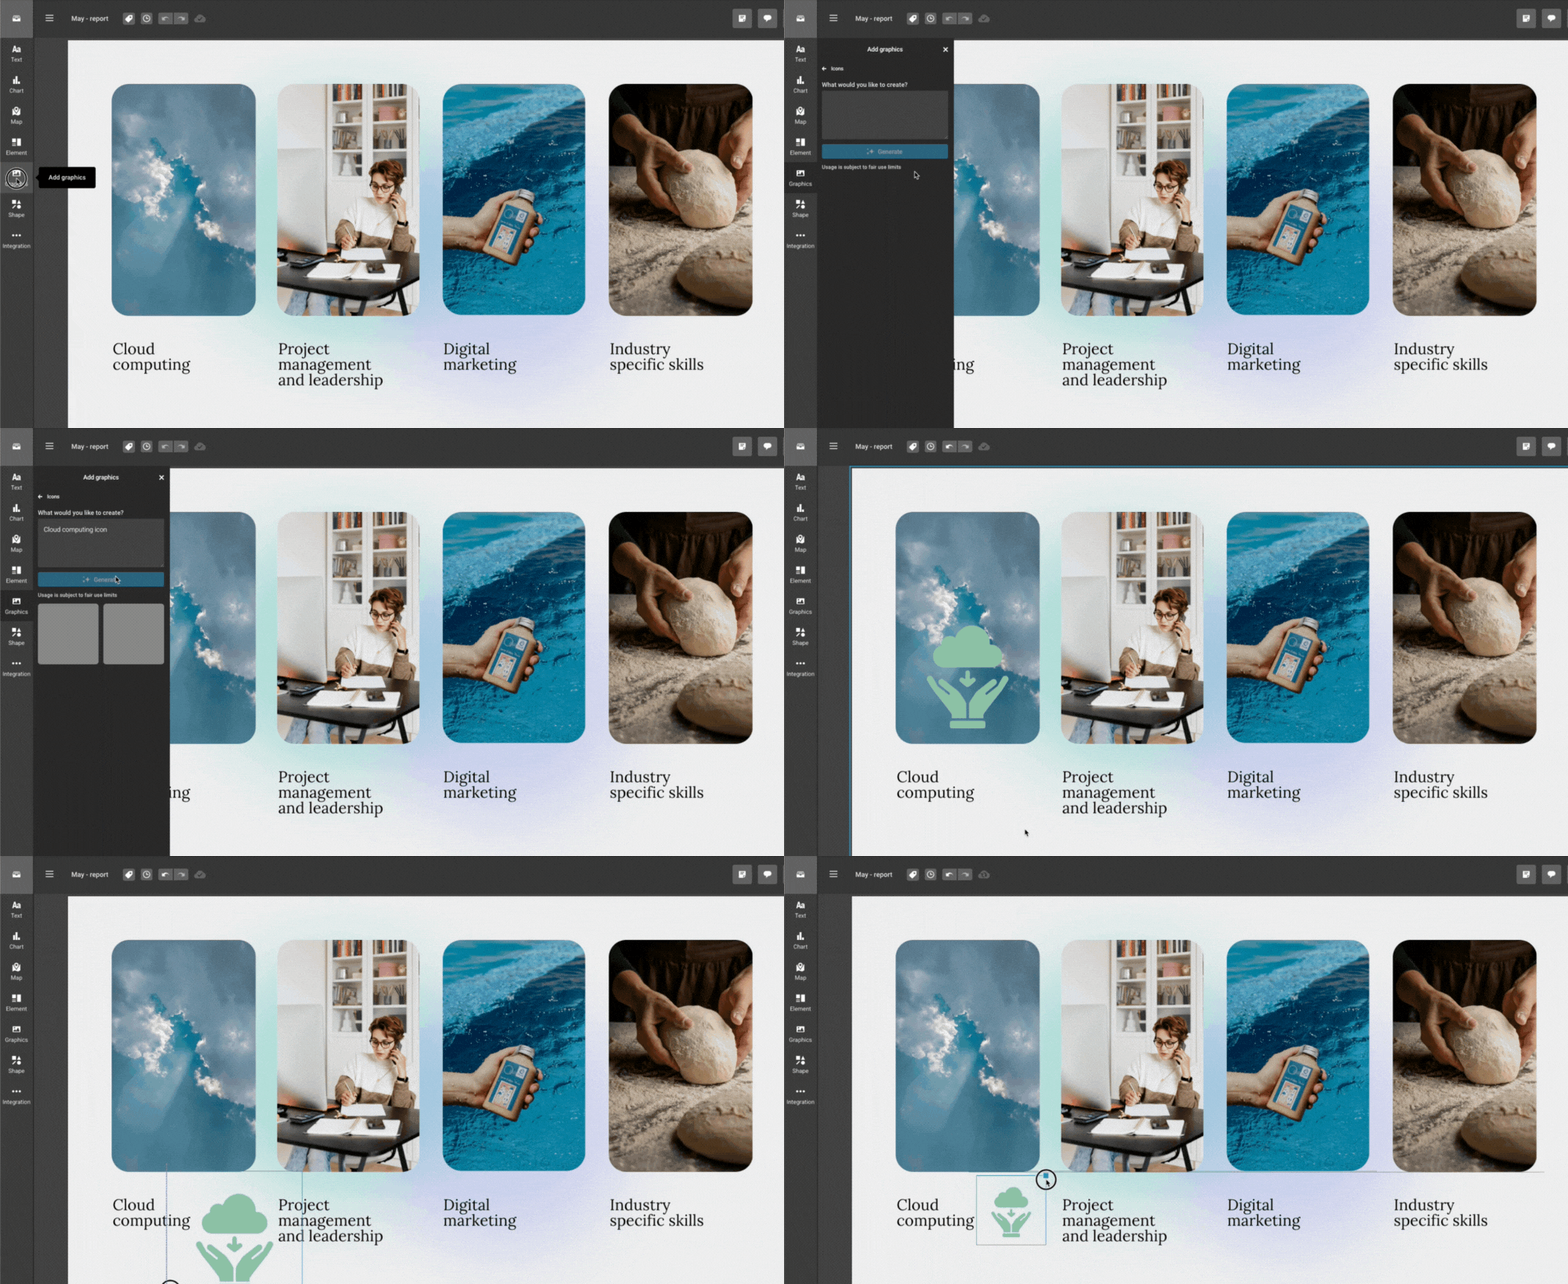
- Open your project in Infogram.
- In the left-hand menu, click the “Graphics” section and choose option “Icons”.
- On the right side of the editor, you’ll see an option labeled “Create your own.”
- In the prompt field, describe what you need. Type a topic or concept (e.g., “growth arrow with dollar sign”, “eco-friendly energy bulb” or “mental health”).
- Let the AI do the rest – it will generate a unique icon or graphic to match your description.
- Use it instantly. Drag the icon into your chart, slide, or report. You can adjust its size and color as needed.
Ready to try it out? With AI-generated icons, you’re no longer limited to what already exists. Now, you can create exactly what you need – instantly, creatively, and on your own terms.
Try it now! Log in to Infogram, open your project, and head to the “Graphics” section in the left-hand menu to get started.
Get data visualization tips every week:
New features, special offers, and exciting news about the world of data visualization.