22.02.2018 by Anete Ezera
We know how hard it is to grab people’s attention on social media, but we have a solution – charts! Data visualizations, maps, and infographics are a fantastic way to engage your social following and attract new fans. Fun facts and impressive stats, transformed into eye-grabbing visuals, instantly light up your feed. They are also a quick way to gain credibility, build trust, and establish yourself as a leader in your field.
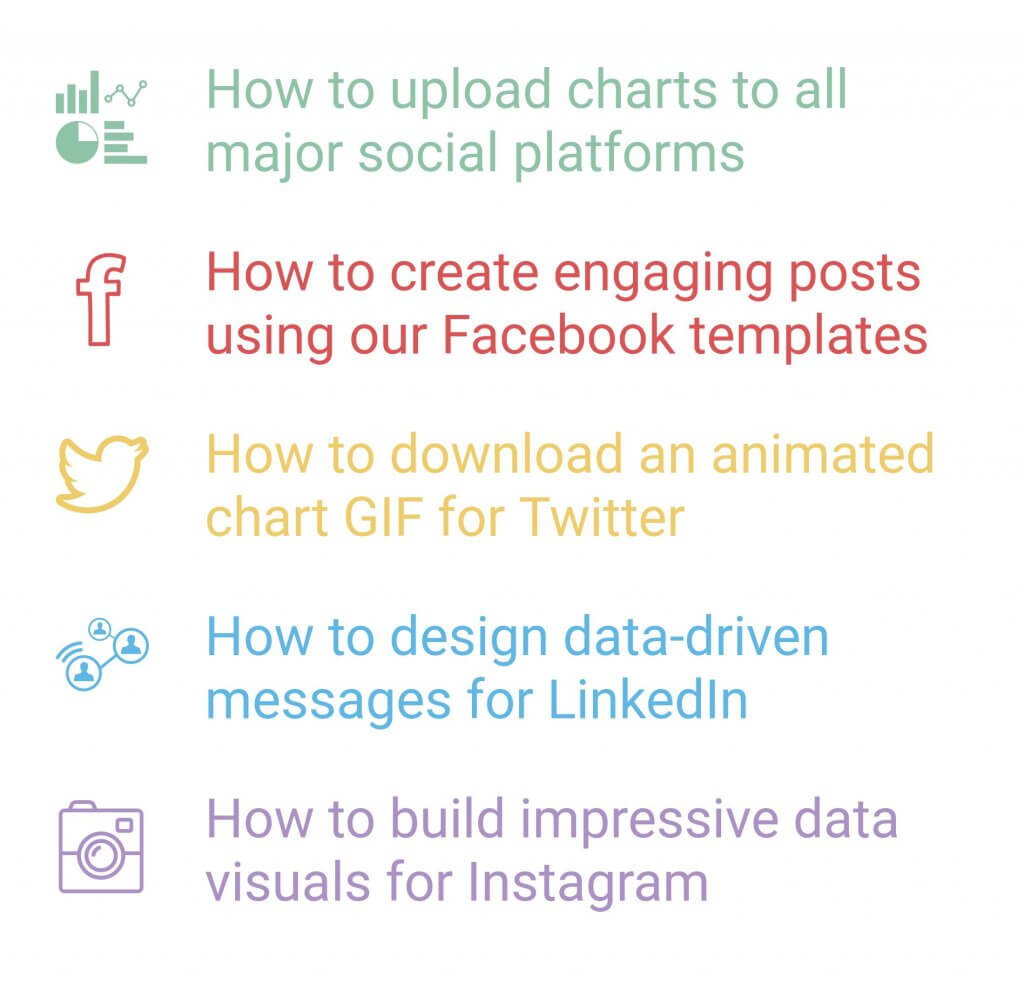
We’ll show you how to build data visuals with Infogram that are perfect for your next social media campaign. We offer projects that are the ideal size for all major social channels, beautiful designer templates, and a variety of publishing options.
Watch the video to learn:
Infogram’s flexible drag-and-drop editor is intuitive and easy to navigate. We have more than 35 chart types, over 550 maps, and 1 million images and icons you can make your own. With Infogram Business, you can upload your company logo and download your new social images as JPG and PNG. Try Infogram Business FREE for 14 days!
Get data visualization tips every week:
New features, special offers, and exciting news about the world of data visualization.