19.07.2016 by Infogram
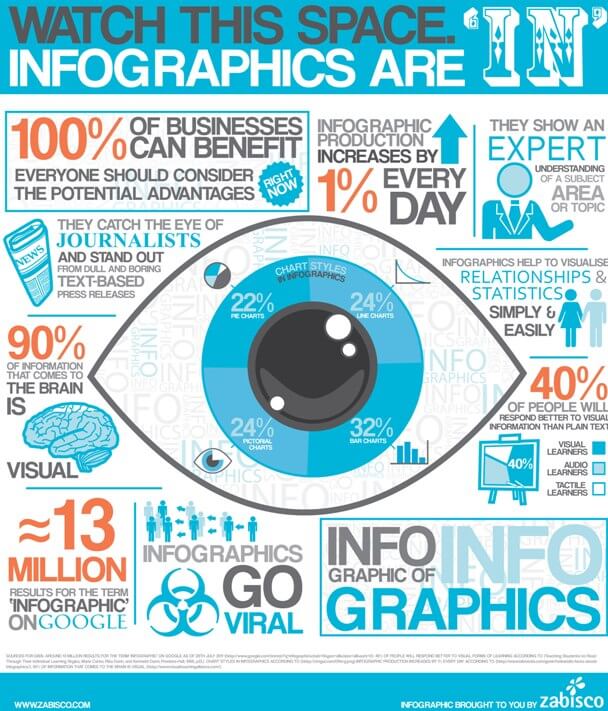
We don’t need to tell you that great visuals make for great marketing. Why are visuals so important? Because 90% of information that comes to the brain is visual and 40% of people learn better with visuals than plain text.
The addition of compelling visuals to landing pages, advertisements, blog posts, email campaigns, and social media updates can have a profound impact on your audience. This is why we’ve put together a list of the types of visuals that get people talking and make your marketing efforts more memorable:
1) Infographics
Infographics are liked and shared on social media 3X more than other any other type of content. They are the perfect blend of data, design, and storytelling. Infographics make it easy to share complex information in just seconds, which is what you need to do to grab people’s attention. So, if you have data to back up your claims, along with additional visuals to incorporate, an infographic might do the trick.
2) Video
A shocking 64% of consumers are more likely to purchase a product after watching an online video, and video has an average lifespan of four years! That is an eternity when compared to the shelf life of a Facebook post or tweet. People spend more time on websites that contain videos and they help you build trust with your audience, so they are a great investment.
Would you like to experience the full power of data visualization? Try Infogram for Teams or Enterprise for free! With a Team or Enterprise account, you can create up to 10,000+ projects, collaborate with your team in real time, use our engagement analytics feature, and more. Request your free demo here.
3) Photos
You know what they say – a picture is worth a thousand words. Content with relevant images gets 94% more views than content without relevant images. Photos catch people’s eye and keep them on articles and blog posts longer. There are multiple great websites you can use now to find free stock images. Try Upsplash or Pexels for a great selection of pics you are free to use!

4) Visualizations
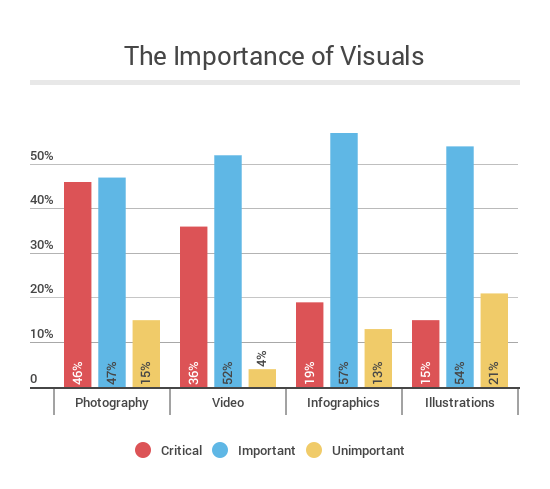
It’s no secret that we love data visualizations. Charts, graphs, and maps bring data to life in an engaging way. Plus, people are more likely to retain your message. Articles that contain charts and infographics show significantly higher reader engagement – up to 34%!
5) Quotes + Memes
Do you have any great quotes you want to share with your audience? Maybe a stellar user review or case study showcasing your brand in a good light? Maybe you have some crafty funny meme you’d like to add to your next blog post or email. Quotes and memes make you relatable and help people remember you! Design tools like Canva make it easy to make your own.
6) Screenshots
Screenshots, or screen captures, are the best visual tool to help offer instruction and guidance. They are particularly useful if the product or service you are offering is technical in nature. People appreciate screenshots when they are learning how to navigate a new program or use an application. Most computers and mobile devices have a screen capture shortcut. Or, you can use awesome online tools like Skitch.
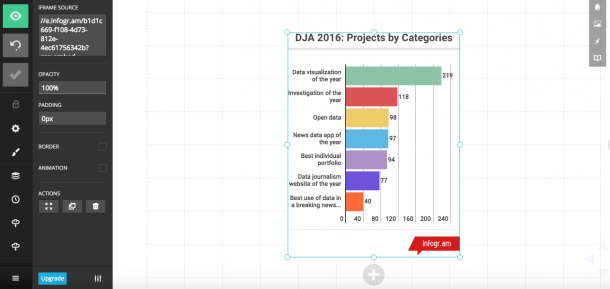
The image below was used to explain how to add interactive Infogram charts to Slides.
7) CTAs
A call to action (CTA) is a marketing tool used to provoke an immediate response from an audience. A blog post, no matter how well-written, is considered incomplete without the proper CTA. These clickable bits of text can be can be subtle like ‘watch this video’ or ‘follow us on social media,’ or they can be more demanding like ‘call now’ or ‘visit a store today.’ Effective CTAs are the best way to guarantee conversion.
8) Questions + Quizzes
Highlighting a question visually is one way of inviting your audience to give feedback. It’s the fastest way to get your reader thinking and connected. A solid pointed question or short focused quiz are genius marketing tools to ensure your reader’s engagement. Try to avoid ‘yes’ or ‘no’ questions. Give your reader a chance to provide in-depth answers.
9) Presentations
Presentations have left the boardroom and are now more popular than ever! There are a ton of amazing online presentation tools that help you build slick, professional slide decks. Gone are the days of static bulleted lists. Today’s presentations are interactive, available from any device, and fun to share. Presentations are similar to infographics, with their focus on design and color, but they offer more depth and greater scope.
10) Animated GIFs
Animated GIFs are the best! One might argue that GIFs are more effective than photos because they contain action and movement. Not only that, they might even be more effective than videos because they convey meaning quickly without taking up the bandwidth. It’s amazing what a few seconds of animation can share with your audience.
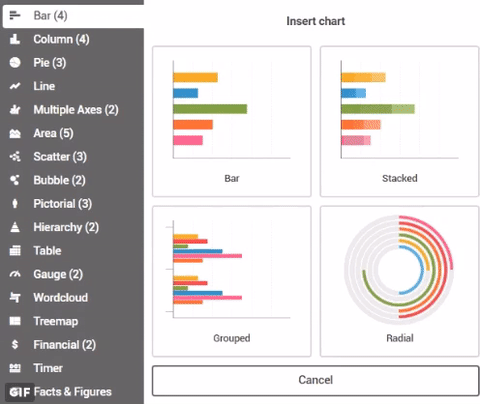
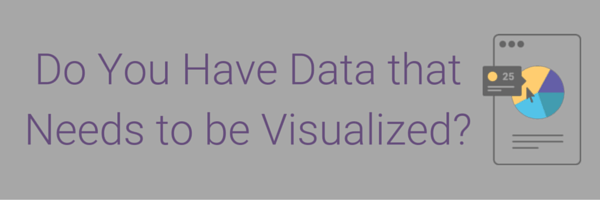
Do you have data you’d like to visualize for your next marketing campaign? Spice up your marketing with charts and infographics. Infogram has over 35+ different chart types and 200+ regional maps for you to choose from.

Get data visualization tips every week:
New features, special offers, and exciting news about the world of data visualization.