19.03.2025 by Infogram
Thirteen years ago, Infogram started with a small idea and a big goal: to help people make sense of data. This month, as we celebrate our 13th anniversary, that idea has grown into something amazing. Launched in February 2012, Infogram now serves 10 million users and over 30,000 companies across more than 160 countries, turning numbers into interactive visuals that work for everyone, from solo creators to large enterprises.
The Beginning of a Better Way
It all kicked off with Uldis Leiterts, Raimonds Kaze, and Alise Dirika – three people who saw data visualization as more than just charts. They wanted it simple and useful for everyone. From that spark came Infogram, now a trusted tool for millions sharing their data with clarity.
Infogram Today: Simple Tool, Big Impact
What can you do with Infogram? Build interactive charts, maps, infographics, reports, and more – visuals that catch the eye and make your point. With AI to help out and options to share or embed anywhere, it’s an easy way to make data count, whether for a team briefing or a public post.
A Few Highlights from the Last 12 Months
This year, we’ve added some practical improvements to keep Infogram sharp:
- AI Made Easy: Tools like AI chart suggestions, an AI Infographic Maker, and text-editing features take the stress out of creating. Find the perfect visual or fine-tune your words in no time.
- API Boost: Our upgraded API makes it simpler for developers to integrate maps, charts, and dashboards – saving time and effort.
- Open to More: WCAG 2.2 compliance brought keyboard navigation, focus indicators, and screen-reader support, making Infogram easier for everyone to use.
- Safety First: With SOC 2 Type II certification, we’ve doubled down on security – think firewalls, two-factor authentication, and more – to keep your data safe.
Why People Stick with Us
Infogram’s grown to 10 million users and over 30,000 companies, but it’s the people behind those numbers that matter. Teams simplify stats, businesses share insights that click, and creators bring ideas to life. Here’s what some of our users say:
“The interactive charts and live updates were a perfect fit,” notes Tom Hedges, Brand & Design Manager at B Lab Global.
We’re proud to be part of their stories.
On to Year 14
Reaching 13 years is a moment to celebrate – and to say thank you! ❤️ To every user and team who’s picked Infogram, you’ve shaped this journey. We’re already planning what’s next, keeping it simple and useful as always.
Happy 13th anniversary from all of us at Infogram! 🎉
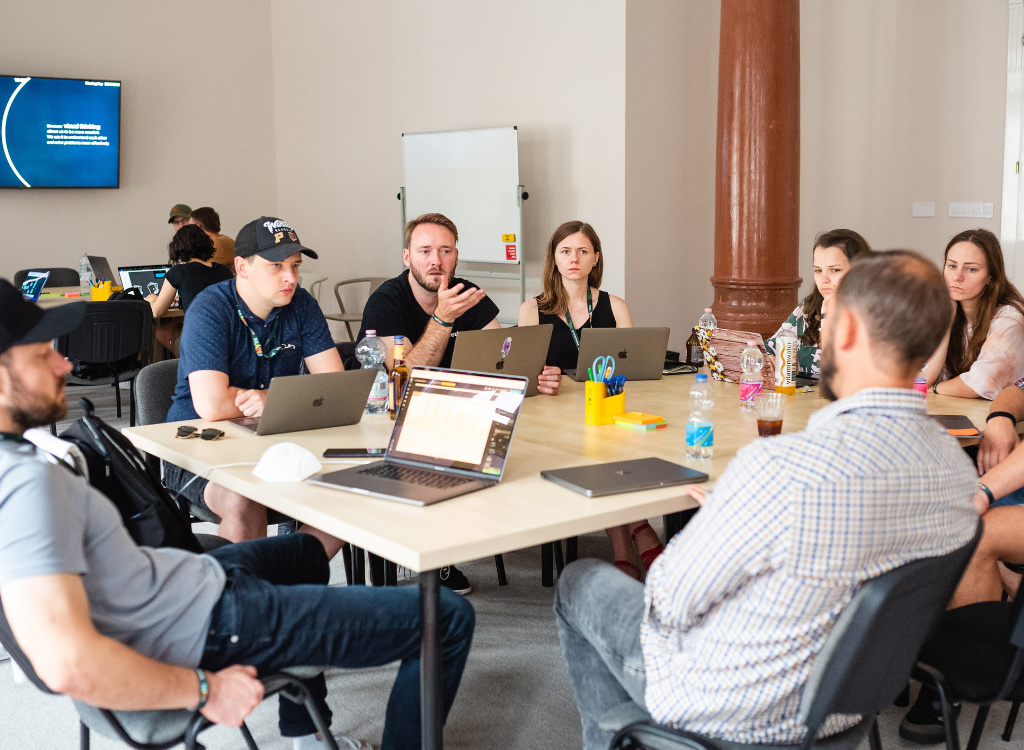
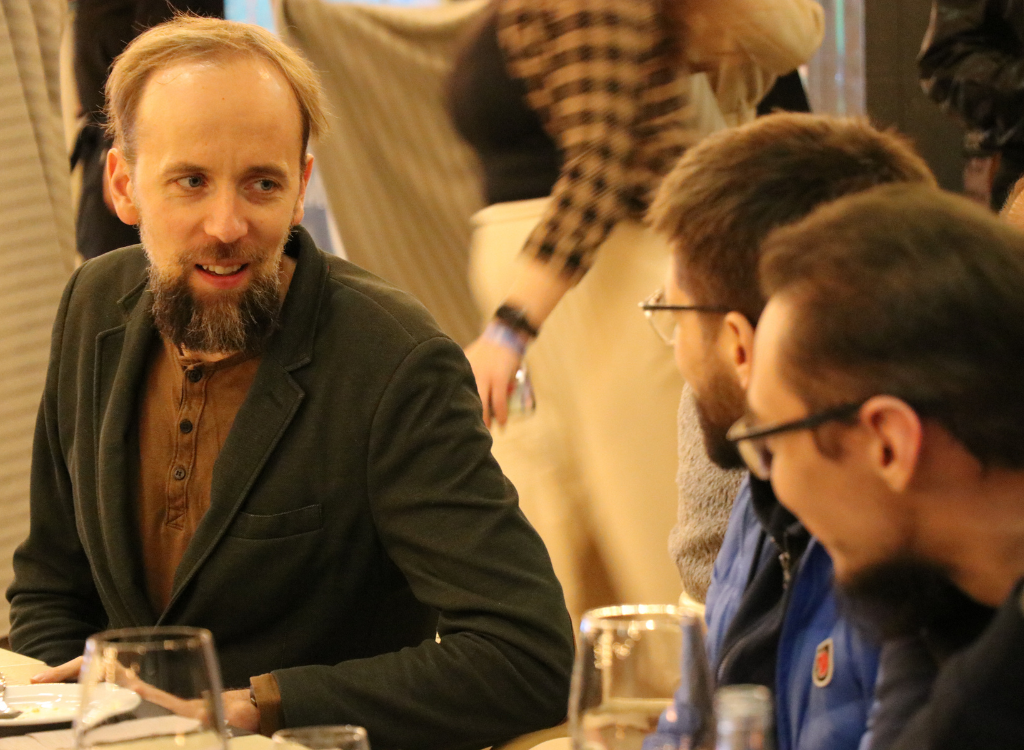
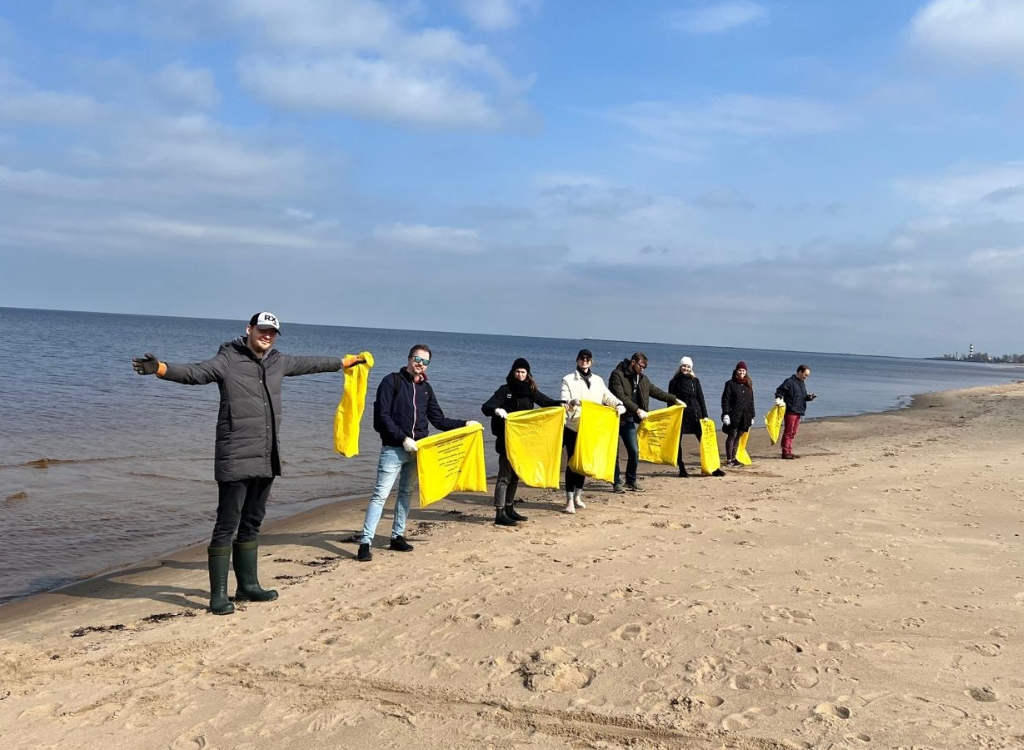
Last Year in Action: Team workshops, anniversary dinner, annual meetup, sports games, and a beach monitoring and clean-up walk.


Get data visualization tips every week:
New features, special offers, and exciting news about the world of data visualization.