25.08.2016 by Infogram
The Infogram office can’t stop talking about GIFs and maps! Our team has spent the past month tweaking chart settings, creating new map options, and adding the ability to make chart GIFs. Here are Infogram’s major updates for the month of August:
1) Introducing GIFs
We are very excited to announce our new GIFs feature. You now have the ability to save any chart as an animated GIF. Not only can you turn any Infogram chart into a GIF, you can also upload GIFs to your Infogram library and add them to your next infographic.

Our GIF feature is brand new, and people are already sharing their creations on social media! GIFs are the perfect addition to any tweet, blog post, article, presentation, report, or email marketing campaign.
Playing around with @infogram‘s GIF feature by showing today’s Olympic medal standings. #digitalmarketing #TeamUSA pic.twitter.com/jRdpKwU7Le
— Ally Sherman (@Ally_Sherman) August 18, 2016
2) Map Tile Layers, Region Names, and Icons
Infogram’s mapping options have skyrocketed. In July we introduced the addition of region names and 200,000+ icons. Now you can create map tile layers for a more detailed, interactive mapping experience.
Simply double click your map to open the editor window and select ’tile layer’ from the top bar. Once you have turned ’tile layer’ on, you can switch between Wikimedia maps, watercolor, and a few options that are ideal for printing. Pretty cool, huh?
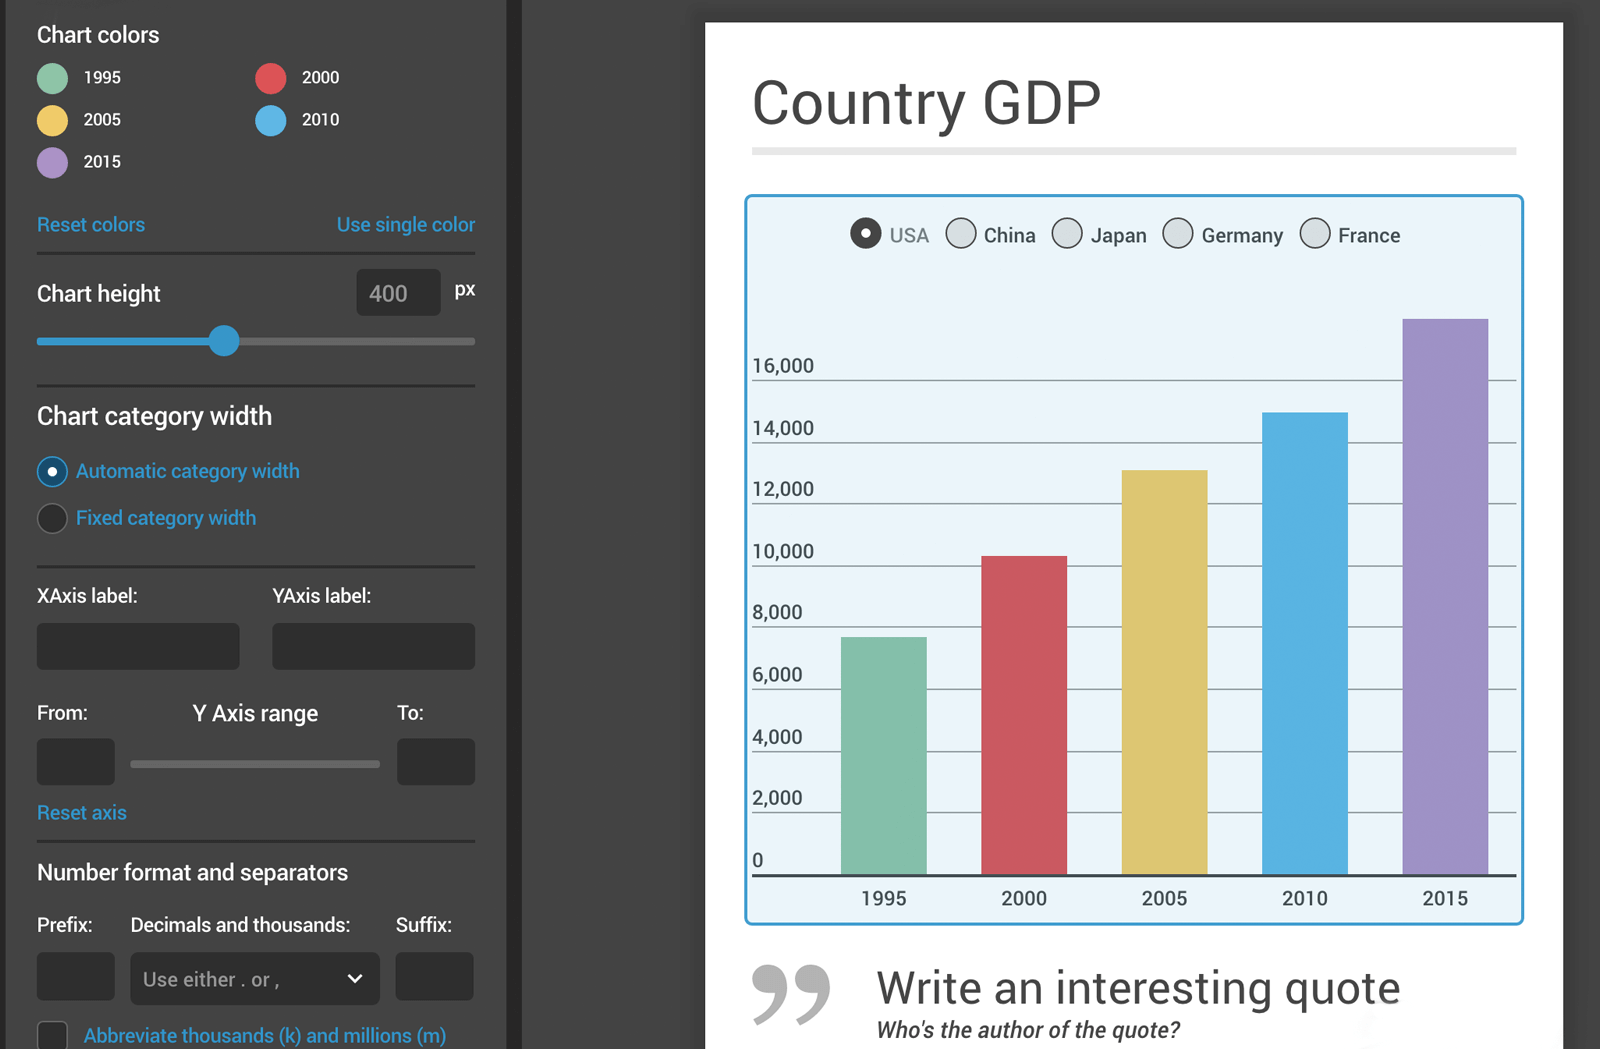
3) Enhanced Chart Settings
Pie Chart – Pie chart call-out labels have been cleaned up for more space and better readability.
Column Chart – Our default column chart now applies the Golden Ratio to the spacing between bars.
4) Node.js API Library
If you want to integrate the Infogram API with a node.js application, feel free to use our library. For more information, click here.
Would you like to experience the full power of data visualization? Try Infogram for Teams or Enterprise for free! With a Team or Enterprise account, you can create up to 10,000+ projects, collaborate with your team in real time, use our engagement analytics feature, and more. Request your free demo here.

Get data visualization tips every week:
New features, special offers, and exciting news about the world of data visualization.