27.07.2017 by Infogram
If you’re in the process of building a presentation, chances are you have data you’d like to include. We know you want your data to be impressive and memorable.
In 2017, it’s possible to wow your audience with an engaging data-driven presentation. That’s why we’d like to show you how to easily add Infogram charts to the popular presentation tool Prezi, which is known for its highly effective interactive canvas.
We’ve made a short video to walk you through the process. You can also scroll down for a more in-depth look at how to add Infogram charts to Prezi.
1) Make a Chart
With Infogram, you have the option to create a new infographic, chart, or map. While you can download individual elements of an infographic, we suggest you work on one chart at a time when designing with a presentation in mind. This gives you more flexibility.
If you do have an individual infographic element you’d like to add to your presentation, reference the ‘Download’ section below for details.
2) Customize
Infogram offers multiple fun, colorful templates for you to make your own. You can also customize the colors and fonts of your charts to align with your brand and company guidelines. We suggest you make all of your charts look the same so the flow of your presentation is consistent and natural.
3) Download
JPG or PNG
When you’re finished with your Infogram chart you have the option to publish and share online, or you can download the chart as a static image – perfect for presentations. The JPG format is great for the web, but if you want a higher-quality image download your chart as a PNG.
Transparent Background
If you are preparing to download a PNG, you can make the background transparent. This makes the transition from Infogram to your Prezi presentation seamless, without interfering with your template or background.

Element of Infographic
If you want to include a chart you’ve made that is part of an Infogram infographic, simply click the download button on the top right of the infographic editor. You can still enable the transparent background here.
Find the chart or map you’d like to download individually and hover over it until you see the download icon in the right corner. Click, and your download will start automatically.
4) Insert Image Into Prezi
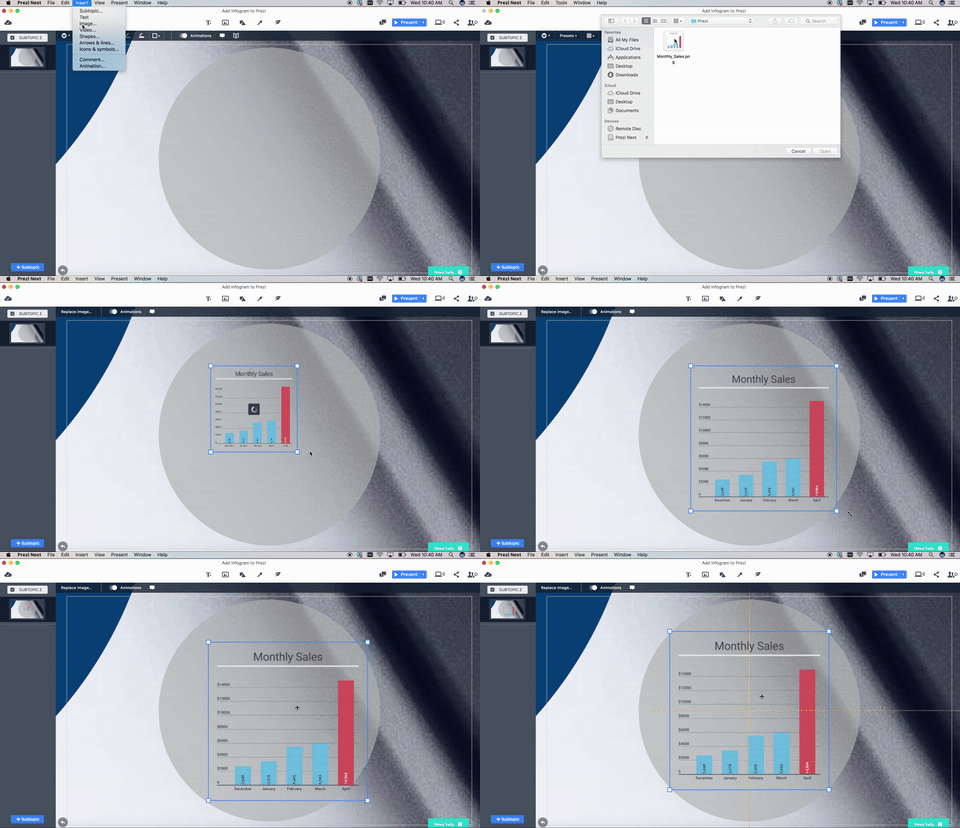
Now that you’ve downloaded your finished chart, it’s time to insert it into your Prezi presentation. Open the topic or subtopic where you want the chart to appear. Delete any unwanted elements that may distract from your data.
Insert an image from the drop down menu and locate your file. Once you see the chart appear on the canvas you can re-size and re-position it wherever you’d like.

If you still have questions, feel free to contact us. And make sure to sign up for the weekly Infogram newsletter for additional data visualization tips and tricks.
Get data visualization tips every week:
New features, special offers, and exciting news about the world of data visualization.