21.04.2025 by Infogram
Recreating charts from images or reports can waste hours of your day. That’s why we’re excited to unveil our beta Image to Chart feature! Upload a chart image or screenshot, and Infogram instantly converts it into an editable chart with extracted data, primed for your creative touch. This game-changing beta tool is built to speed up your workflow and get you back to crafting stories that shine.
Typing out data from an old infographic, a PDF report, or a dusty slide deck is a creativity killer. With our beta Image to Chart feature, Infogram analyzes your screenshot, pulls out the data, and delivers a fully editable chart in seconds – ready to transform into your next masterpiece.
Say goodbye to hours of tedious work. This feature makes repurposing visuals a breeze, letting you harness Infogram’s robust design tools to elevate your projects. For teams, it’s a collaboration booster, seamlessly blending external charts into shared libraries. As a beta feature, it’s cutting-edge and shaped by your feedback, keeping Infogram at the forefront of data visualization. Picture a researcher uploading a bar chart from a journal article and tweaking it for a conference in minutes. Or a designer turning a client’s pie chart screenshot into a branded, interactive infographic. Or a marketing manager pulling a sales chart from a PDF to build a sleek dashboard for the board. Even in beta, this feature supercharges your workflow with speed and flexibility.
How It Helps You
- Time-Saving: Upload a chart screenshot, and let the system extract the data and create an editable chart instantly, eliminating manual data entry.
- Seamless Repurposing: Transform static charts from reports, presentations, or websites into dynamic Infogram visuals, ready for branding or interactivity.
- Boost Creativity: Start with an editable chart and customize it with Infogram’s tools – add animations, tooltips, or brand styles to make it your own.
See It in Action

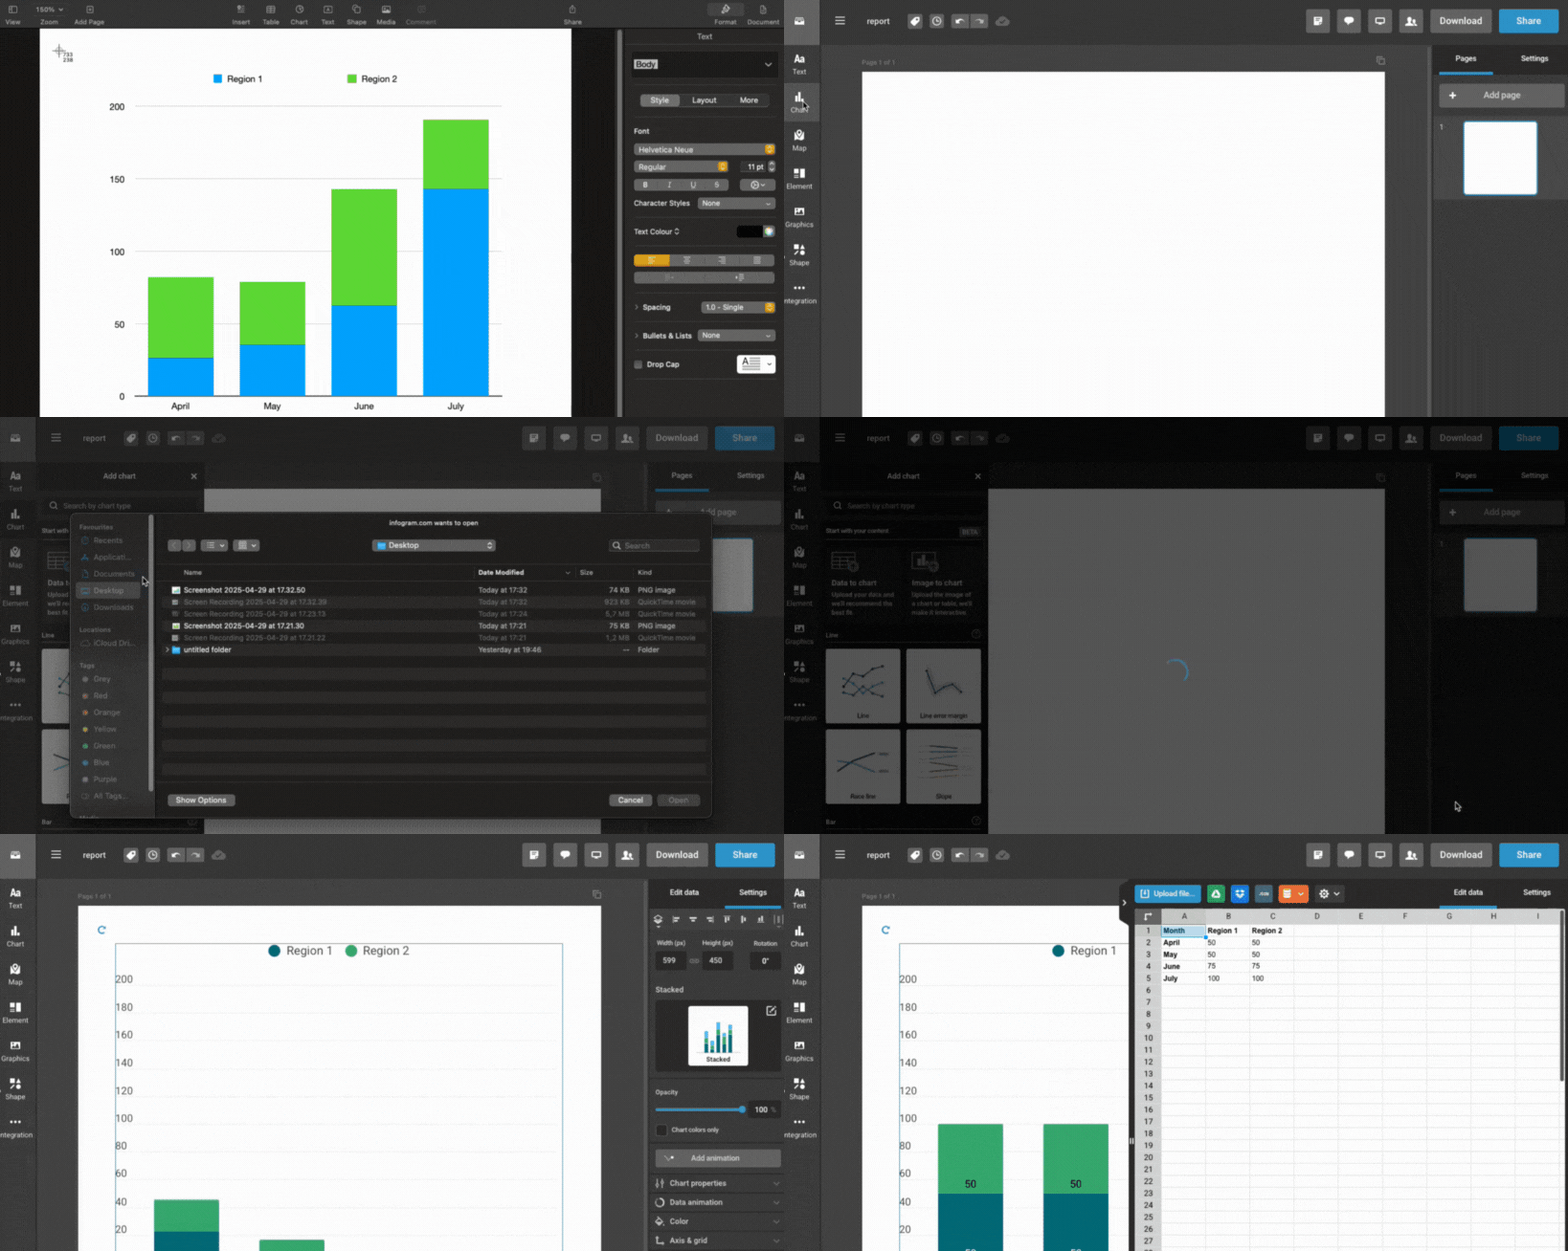
Using the Image to Chart feature is simple and intuitive. In the Infogram editor, select the chart option, choose your image file (PNG, JPEG, etc.), and watch the system work its magic. Within seconds, you’ll get an editable chart with extracted data, ready to customize with Infogram’s design tools. Adjust colors, fonts, or chart types, and add interactive elements like tooltips or animations. Since it’s in beta, we’re fine-tuning the system to handle even more chart types and data complexities – your feedback will help shape its future!
Get Started Today
Ready to save time and supercharge your workflow? The new feature is available now for all Infogram users. Here’s how to dive in:
- Log in to your Infogram account.
- Open the editor and select “Add charts” and “Image to chart” option.
- Upload your chart image and start customizing the editable chart.
As a beta feature, we’re eager to hear your thoughts to make it even better. Share your feedback to our support team or on social media with #InfogramBeta. Start transforming chart screenshots with Infogram’s beta feature today and take your data storytelling to the next level!
Get data visualization tips every week:
New features, special offers, and exciting news about the world of data visualization.