11.05.2017 by Infogram
Infogram has always been a huge supporter of interactive data visualizations. We offer tabs that allow you to display multiple datasets on one chart, tooltips so viewers can access specific data points and optional text, GIF downloads, and now linking capabilities for more advanced information digging.
A hyperlink (commonly referred to as a link) is a way for users to navigate between pages on the internet. They deliver huge benefits when it comes to SEO, but they also boost site traffic, increase engagement, and give viewers additional helpful resources.
Would you like to experience the full power of data visualization? Try Infogram for Teams or Enterprise for free! With a Team or Enterprise account, you can create up to 10,000+ projects, collaborate with your team in real time, use our engagement analytics feature, and more. Request your free demo here.
Let’s go over why links are beneficial, how you can add them to your next Infogram project, and walk you through the process with a simple video tutorial:
Why Add Links?
1) Boost Traffic – Adding links to your own pages can drive traffic to older posts, landing pages, and other relevant information. It shows you have experience writing about a specific topic and gives you more credibility.
2) Interactivity Increases Engagement – Interactive charts, maps, and infographics are more engaging than static images. Viewers have the chance to fully explore the data on their own, which piques their interest and keeps them on your page longer. You’re offering your viewer an experience, not just a quick read.
Online publishers use interactive visualizations to break up the flow and grab reader’s attention. In fact, 90% of readers spend more time on pages with interactive charts or infographics and 34% have shared them more often on social media.
3) Offer Additional Clicks for Curious Viewers – Once you have captivated your viewer’s focus, it is great to offer links to more information. It shows you know what you’re talking about and ultimately builds trust.
How to Add Links to Infogram Projects
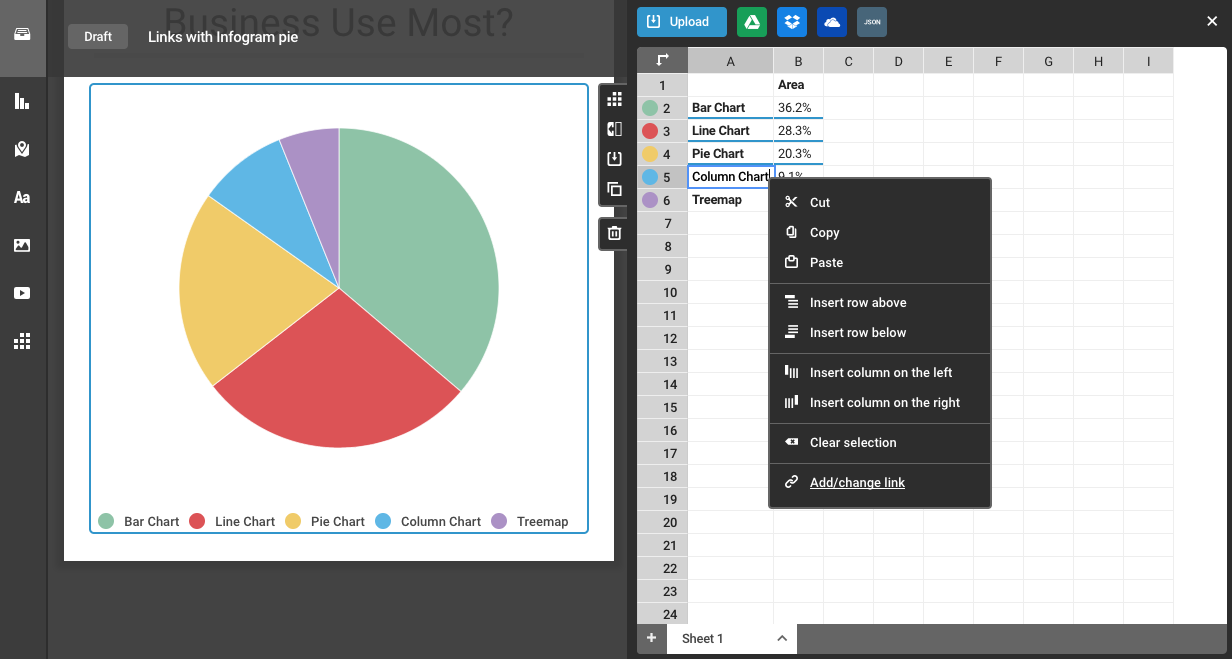
With Infogram you can add links to chart elements (like a single bar, column, line, or pie slice), images, and map regions. This allows you to easily add depth and extra detail to your work. I’ll use a pie chart as my first example. I’ve created a pie chart using data from a fictional business, featuring the charts this company uses most often.

● Adding links to chart elements – Copy the URL for the link you’d like to add to your chart. Double-click on the chart to open the data editor. Click the cell you’d like to link to your URL and select ‘add/change link’ from the drop down menu. You can then paste your URL in the box provided and hit ‘apply.’ You will see a blue line appear in the cell once the link is successfully added. You’ll be able to click on your chart and explore your links once you’ve published your project and embedded it online.
In the case of this pie chart, we linked each slice to a landing page we created for each chart type. This gives the viewer additional information about when to use these charts and best practices for designing them correctly. This is not only educational for the viewer, it is also a great way to direct traffic to our new resource pages. See for yourself!
● Adding links to images – Adding links to images is easy. Simply click on the image you’d like to link. You’ll see the options to adjust image size and ‘add link’ on the right-hand side. Click ‘add link,’ paste your URL, and hit ‘apply.’
● Adding links to map regions – You can add links to map regions the same way you add links to individual chart elements. Double-click on the map to open the data editor. Select the cell you’d like to add a link to, paste the URL, hit ‘apply,’ and watch for the blue line to confirm your link attachment was successful.
Watch a Quick Video Tutorial
If you’d like to see our new linking feature in action, check out this short video tutorial.
Can’t wait to create a chart or map with links, images, and seamless interactivity? Log in to Infogram to get started, and make sure to sign up for our newsletter below.
Get data visualization tips every week:
New features, special offers, and exciting news about the world of data visualization.