14.03.2024 by Infogram
If you’re looking to visualize data but aren’t sure where – no worries. This article will provide a helpful list of the best data visualization tools for you to consider.
We, at Infogram, know how important it is to find the right data visualization tool. Whether you need to create a dashboard to visualize sales performance or an infographic to showcase a project timeline, you need a tool that offers accessibility, flexibility, visual appeal, and ease of use. Only with these traits and helpful features can you easily create an engaging and captivating data visualization that informs and attracts.
With many data visualization tools available, you might feel confused or overwhelmed to choose the right one for you or your team. That’s why in this article, we’ll provide a list of the best data visualization tools, underlining key features and considerations, based on our findings in Capterra, a dependable software review platform. Also, we’ll highlight and take a closer look at Infogram, exploring what key features we offer and how Infogram differs from other data visualization tools. So – let’s dive right in!

What are the characteristics of the best tools for data visualization?
Before listing the different data visualization tools, let’s quickly take a look at what are the defining features of the best tools for data visualization.
Effective and free data visualization tools share many common characteristics. These tools prioritize user-friendliness, customization options, and the ability to convey complex information in a visually appealing manner. Let’s examine the key attributes that define a good data visualization tool:
- User-friendly interface: A good data visualization tool should offer an intuitive interface that makes it easy for users to create stunning visuals without extensive technical expertise.
- Customization options: The ability to customize charts, graphs, and other visual elements is essential for tailoring presentations to specific audiences and branding requirements.
- Visual appeal: Visual aesthetics are crucial in capturing the audience’s attention and communicating information effectively. The best tools offer a wide range of design options to create visually striking data visualizations.
- Data integration: Seamless integration with various data sources allows users to import and manipulate data effortlessly, streamlining the visualization process.
- Responsive design: Visualizations that adapt to different screen sizes and devices ensure a consistent user experience across desktop, tablet, and mobile platforms.
What separates good from the best?
Advanced customization: Advanced customization features allow users to tailor visualizations to their specific needs, including adjusting colors, fonts, labels, and layout.
Interactivity: Tools that offer interactive features such as tooltips, zooming, filtering, and drill-down capabilities enable users to explore data more effectively.
Performance: The best tools should be able to handle large datasets efficiently, without sacrificing speed or responsiveness.
Rich visualization options: A wide range of visualization types (e.g., bar charts, line graphs, scatter plots, heatmaps, etc.) allows users to choose the most suitable representation for their data.
Export and sharing: Tools that allow users to export visualizations in multiple formats (e.g., images, PDFs, interactive HTML) and share them easily via email, social media, or embedding in websites.
Collaboration features: Collaboration features such as real-time editing, commenting, and sharing permissions enhance teamwork and facilitate feedback among users.
Security and privacy: Robust security measures to protect sensitive data, user authentication, and role-based access control are essential for enterprise-grade data visualization tools.
Community and support: Access to a vibrant user community, documentation, tutorials, and responsive customer support can make a significant difference in users’ ability to leverage the tool effectively.
Advanced analytics: Integration with advanced analytics and machine learning capabilities can enable users to gain deeper insights from their data and create more sophisticated visualizations.
Live data visualization: Support for real-time or streaming data visualization allows users to monitor and analyze live data feeds for timely decision-making.
Cost-effectiveness: While some advanced features may come at a premium, the best tools strike a balance between functionality and affordability, offering value for money.
Continuous improvement: Regular updates, feature enhancements, and responsiveness to user feedback demonstrate a commitment to innovation and improving the user experience over time.

The best data visualization tools
Infogram
Key features
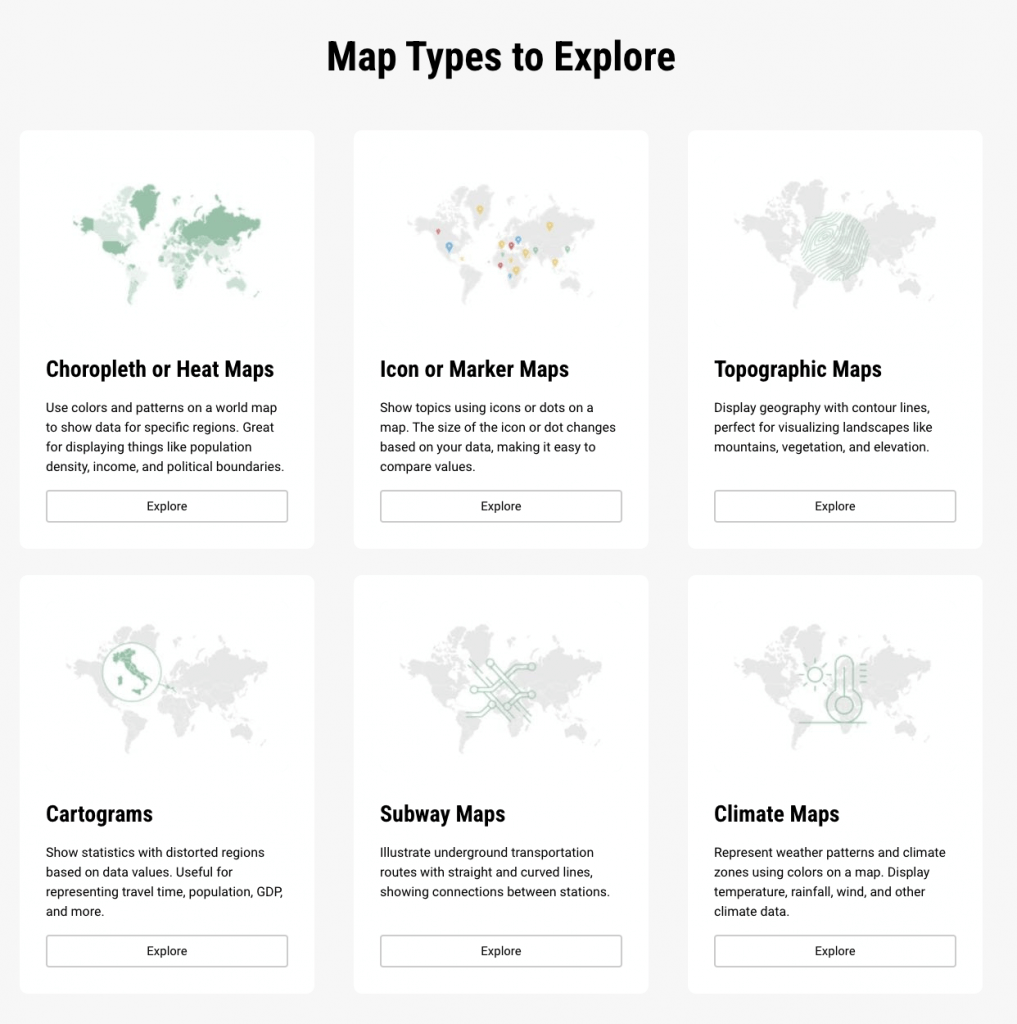
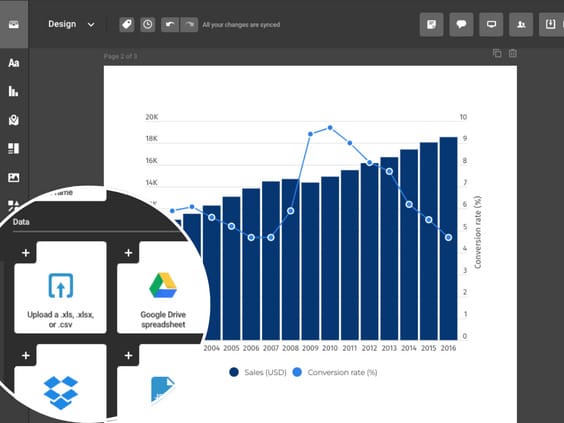
Rich visualization options: Go beyond basic bar charts and pie charts. Infogram lets you create captivating maps, engaging infographics, dynamic timelines, and even interactive reports. Get creative with a wide range of chart types, customizable maps, and impressive animation capabilities.
Highly engaging interactivity: Turn static data into an interactive experience. Infogram’s interactive features allow users to drill down into details, filter information, and explore different perspectives intuitively. Add tooltips, popups, filters, and other elements to create visualizations that spark dialogue and understanding.
Extensive image/map library: No need to spend hours looking for visuals elsewhere. Infogram’s built-in library contains a rich set of icons, images, and royalty-free illustrations to perfectly complement your data story. Not to mention, the interactive map library – we offer over 200 regional territories that you can use to create beautiful maps ranging from global to local scales.
Essential considerations
Limited capabilities in the free plan: While the free plan is generous, creating multiple projects or exporting high-resolution visuals might require upgrading.
Focus on simplicity: Infogram excels in user-friendliness, but advanced users seeking maximum customization options could find it limiting to an extent. might prefer other options.
Tableau
Key features
User-friendly interface: With Tableau, you can analyze data without a steep learning curve. Tableau’s drag-and-drop interface makes it easy to explore, visualize, and share insights effortlessly. Intuitive controls and visual cues guide you through the process, making it easy to create attractive visualizations even without prior experience.
Analytics capabilities: Tableau offers a robust set of analytic features, including calculations, aggregations, and statistical functions. Leverage trend lines, forecasting models, and correlations to uncover hidden patterns and trends within your data.
Resources: Tableau offers a great range of resources, tutorials, and troubleshooting tips. You can spend time exploring forums, knowledge base articles, and webinars to learn from others and improve your Tableau experience.
Essential considerations
Cost can be a barrier: The cost of Tableau licenses can be prohibitive for small businesses or individual users.
Advanced features require dedication: While easy to start, mastering complex analysis and customization might require significant learning time.
Performance limitations with large datasets: On less powerful hardware, handling large datasets can lead to slowdowns.
Note: This information is based on our findings at Capterra.
D3.js
Key features
Customization options: D3.js offers thorough control over every visual element, allowing you to craft pixel-perfect visualizations tailored to your specific needs. Create different chart types, experiment with design elements, and create good-looking data-driven stories that inform.
Flexibility: D3.js isn’t limited to pre-defined templates or functionalities. The low-level library empowers you to construct visualizations from scratch, catering to niche requirements and complex data representations.
Web standard compatibility: D3.js leverages open web standards like SVG and CSS, ensuring smooth integration with modern web applications and cross-browser compatibility. With this, you can create visualizations that are adaptable across different platforms.
Essential considerations
Technical expertise required: D3.js demands fluency in JavaScript and web technologies, making it unsuitable for beginners.
Time investment for complex projects: Building intricate visualizations from scratch can be time-consuming, requiring significant development effort.
Not ideal for quick visualizations: The lack of pre-built templates makes D3.js less suitable for creating visualizations on the fly.
Note: This information is based on our findings at Capterra.
Power BI
Key features
Business analytics: Get holistic insights into your business performance. Power BI offers a rich set of tools for data exploration, modeling, and visualization, catering specifically to business intelligence needs. Analyze large datasets, identify key metrics, and track progress over time with ease.
Range of visualizations: Tell your data story compellingly. Power BI features a diverse range of chart types, including custom visuals, interactive dashboards, and reports. Showcase your findings in visually appealing and easily digestible formats to engage stakeholders and inform decision-making.
Seamless integration with Microsoft Ecosystem: Leverage the power of your existing tools. Power BI integrates seamlessly with Microsoft products like Excel, Azure, and SQL Server, streamlining data import, analysis, and collaboration within your existing workflow.
Essential considerations
Cost barrier: Pro licenses can be a significant expense for small businesses or individual users. Consider exploring the free version or alternative tools with more budget-friendly pricing options.
Learning curve: While the basic interface is user-friendly, advanced functionalities like DAX (Data Analysis Expressions) and M (Power Query Formula Language) require additional learning and technical expertise.
Possibly cluttered interface: The formula help window and side panel often block the view of important elements, making the interface look busy.
Note: This information is based on our findings at Capterra.
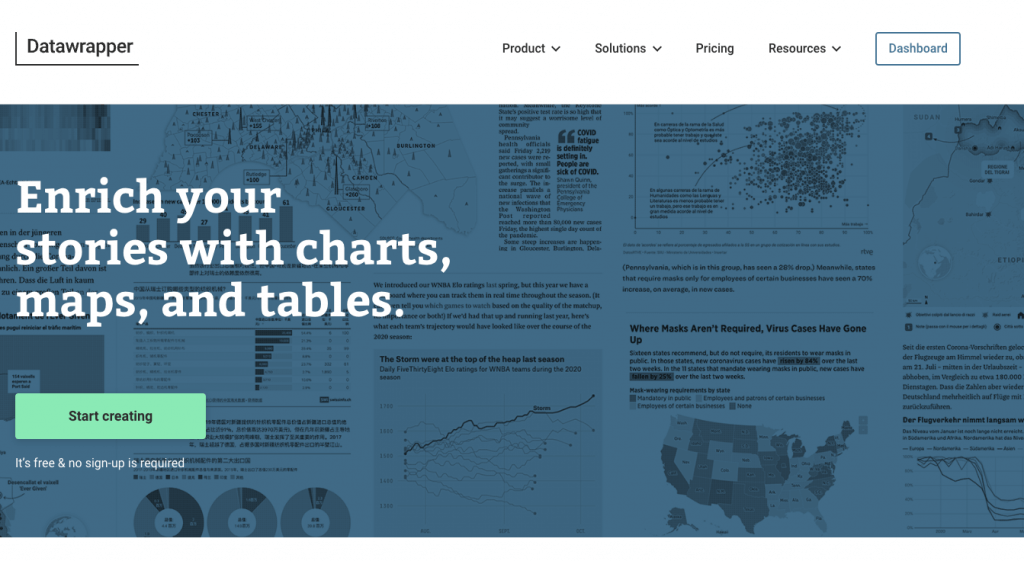
Datawrapper
Key features
User-friendly: Datawrapper’s intuitive interface and customizable templates make creating charts and maps accessible to everyone. Import data from spreadsheets or APIs and choose from a variety of pre-designed styles to suit your needs.
Embeddable charts & maps: Datawrapper’s visualizations are specifically designed for embedding in websites and online publications. Generate embed codes and customize the look and feel to match your website’s aesthetic.
Easy data import: Datawrapper offers several easy ways to import your data, including uploading spreadsheets, connecting to Google Sheets, or pasting data directly. This simplifies the process and allows you to focus on creating good-looking visualizations.
Essential considerations
Focus on simplicity: Datwrapper caters more towards straightforward visualizations. If you’re looking for more interactive dashboards or real-time data analysis consider looking at other options.
Restricted customization: The level of customization might not be sufficient for users who want pixel-perfect control over every visual element. For highly tailored designs, alternative tools might be a better fit.
Limited troubleshooting resources: Resolving complex map-related issues might require deeper technical knowledge or searching for assistance within the user community.
Note: This information is based on our findings at Capterra.
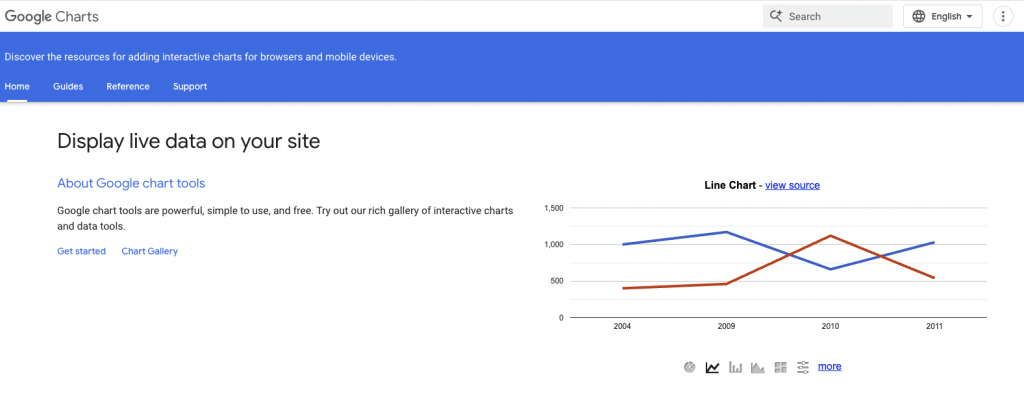
Google Charts
Key features
Free & simple-to-use: Google Charts provides a variety of chart types at no cost, making it a budget-friendly option for individuals and small businesses. The straightforward interface allows you to quickly get started and generate basic charts and graphs with minimal effort.
Integrates with Google products: Google Charts seamlessly integrates with Google Sheets and other Google products, streamlining data import and sharing within your Google workflow. You can access your data and create visualizations directly within your familiar Google environment.
Well-documented support: Google Charts offers comprehensive documentation, tutorials, and community forums to help you get the most out of the tool. Easily find answers to common questions and learn new techniques.
Essential considerations
Basic functionality: Google Charts might not be suitable for complex data representations or visualizations requiring ample interactivity. If you’re looking for more advanced features like custom animations or dynamic elements, consider opting for other tools.
Limited customization: Google Charts might lack the level of customization options found in more advanced data visualization tools. If you need more control over colors, fonts, and other design elements, other platforms might provide more flexibility.
Performance issues: When dealing with complex or massive data sets, Google Charts can struggle. Prepare for slower loading times and potential rendering issues.
Note: This information is based on our findings at Capterra.
Infogram: a closer look
Infogram stands out as a data visualization tool that empowers users to create captivating visuals with ease. With an intuitive drag-and-drop interface, Infogram makes it easy to design captivating and interactive charts, maps, dashboards, infographics, and more without any coding knowledge. Ultimately, Infogram’s user-friendly platform caters to users of all skill levels.
The highlights of Infogram
- Interactive elements: Infogram’s interactive features allow users to engage audiences by adding clickable elements, animations, and tooltips to their data visualizations. This interactivity improves comprehension and encourages audience participation.
- Real-time data updates: With Infogram, you can connect to various live data sources such as Google Sheets, Excel files, and APIs to ensure that your visualizations always reflect the latest information. This real-time updating feature is invaluable for dynamic data-driven visualizations.
- Collaboration features: Infogram’s collaboration capabilities enable teams to collaborate seamlessly on projects in real-time. Whether you’re co-authoring a report with colleagues or requesting feedback from stakeholders, Infogram facilitates flawless collaboration every step of the way.
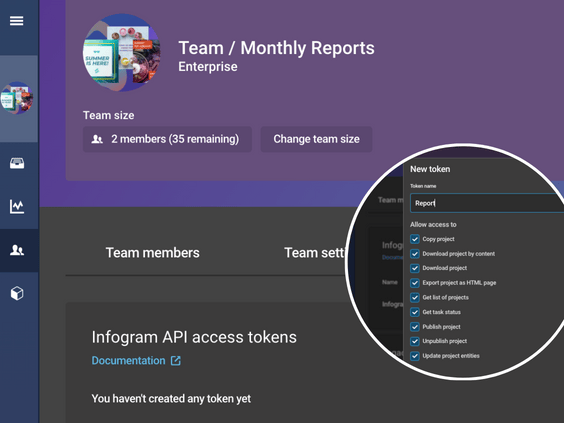
- Export and sharing options: Once your visualizations are complete, Infogram offers various export and sharing options, including downloadable files, embeddable content, and social media sharing. Additionally, Infogram’s new API offers a seamless way to integrate, update, and publish a diverse range of visualizations. This versatility allows you to distribute your visualizations across multiple platforms with ease.
Why choose Infogram?
Infogram isn’t just another data visualization tool. It’s a game-changer, and here’s why:
Effortless creation, maximum impact
- Intuitive drag-and-drop: Forget complex interfaces. Infogram’s drag-and-drop editor lets anyone, from design beginners to data viz enthusiasts, create stunning visuals with ease.
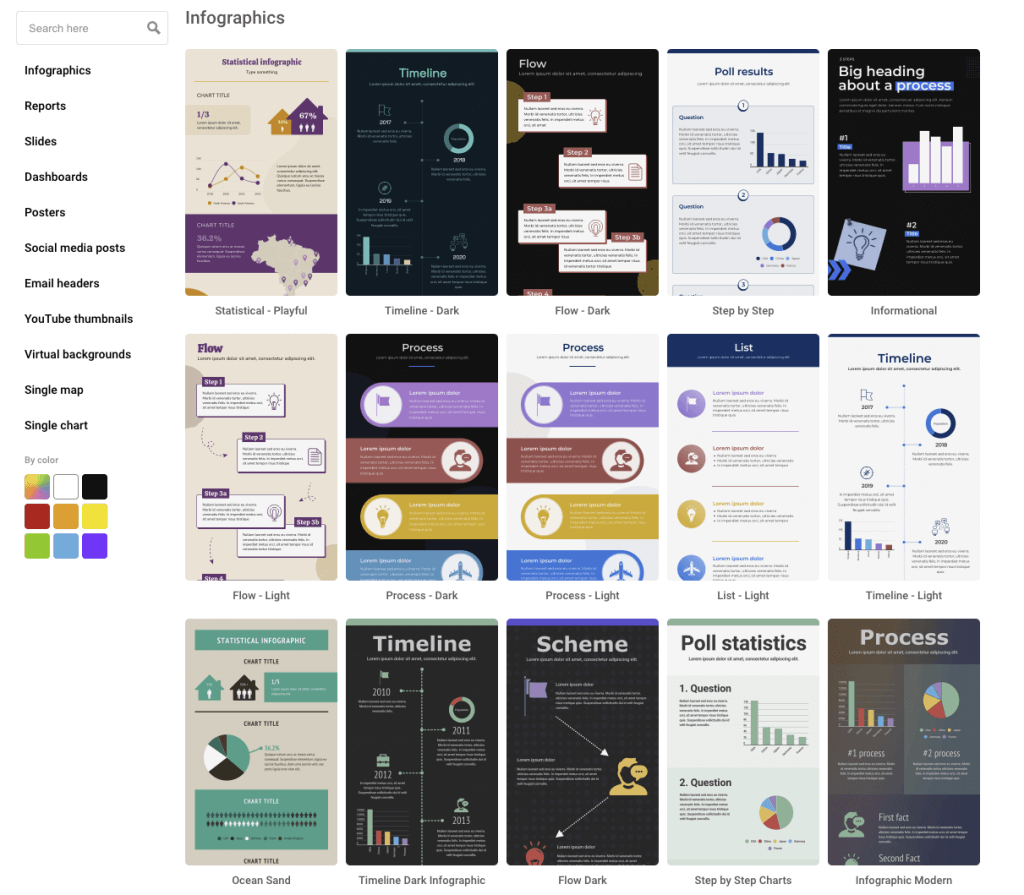
- Pre-built templates: Kickstart your project with pre-designed templates for infographics, reports, dashboards, and more. Customize them to match your brand and data.
- Vast visualization library: Go beyond basic charts and graphs. Infogram offers over 35 chart types, 800 interactive maps, and a million+ royalty-free images and icons to truly captivate your audience.
Engaging interactivity
- Interactive data exploration: Let your viewers explore data in an engaging manner and delve deeper. Infogram’s interactive charts, maps, and elements allow users to explore data at their own pace, uncovering hidden insights.
- Live data updates: Ensure your data visualizations are always fresh. Connect to live data sources and watch your dashboards automatically update, reflecting real-time changes.
- Embed & share seamlessly: Share your creations anywhere! Infogram offers interactive embeds for websites, social media integrations, and downloadable high-resolution files for print.
More than just pretty visualizations
- Brand consistency: Maintain a cohesive brand identity across all your data visualizations with Infogram’s customizable brand kits.
- Accessibility features: Ensure your visuals are inclusive for everyone. Infogram adheres to accessibility standards and offers features like alt text and color contrast options.
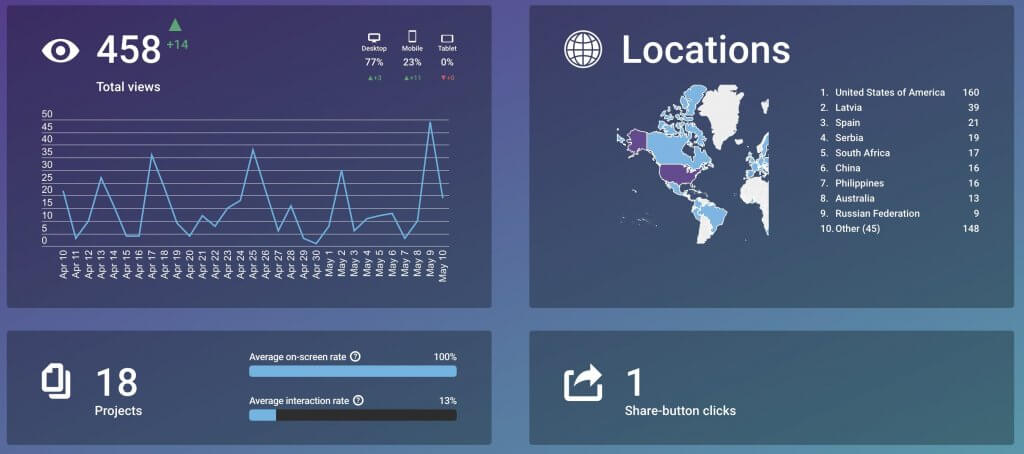
- Data-driven insights: Go beyond the visuals. Infogram provides analytics to track engagement and understand how your audience interacts with your data stories.
Infogram vs. the rest
Here’s how Infogram compares to other tools:
- Ease of use: Compared to complex tools, Infogram’s intuitiveness makes it perfect for beginners and data visualization experts alike.
- Value for money: Infogram offers a free plan and its paid plans are competitively priced with more functionalities than other options.
- Focus on engagement: Infogram’s interactive features and design focus go beyond just presenting data; they help you tell captivating stories that resonate.
The best data visualization tools: Final considerations
Data visualization tools play a vital role in modern communication. And choosing the right one for your specific needs can be challenging. Whether you need to create charts and maps on the go or spend more time creating comprehensive monthly or yearly reports, it’s important to find a tool that supports you with the necessary features along with ease of use.

In this article, we compiled a list of data visualization tools that offer robust features and customization options. From pixel-perfect customization options on D3.js to well-documented support on Google Charts, these data visualization tools offer custom features for their target audience. Among these data visualization tools, Infogram stands out as a leading choice for creating dynamic and engaging visualizations, thanks to its intuitive interface, robust features, and stunning design options. While there are alternative tools available, Infogram’s versatility, ease of use, and collaborative capabilities make it a standout choice for professionals across industries. Whether you’re a data enthusiast, a marketer, or a business leader, Infogram will empower you to tell your story with impact.
Discover the best data visualization examples of 2023 and see what’s possible with Infogram. Plus, explore more examples for inspiration to create different types of projects.
Sign up and start your data visualization journey today!
Get data visualization tips every week:
New features, special offers, and exciting news about the world of data visualization.