24.08.2023 by Infogram
School is right around the corner, and according to a new report by the Common Application, the number of applicants for the school year 2023/24 has substantially increased. The pursuit of higher education is more diverse and dynamic than ever before. With more applicants comes more pressure and competition to succeed. And universities are growing with the number of applicants. Also, teachers are looking to expand their teaching methods, introducing more digital tools like data visualizations and infographics.
As students start their journeys toward higher learning institutions, understanding the critical nuances of college and university statistics is crucial. That’s why in this article, we’re going to explore key college statistics in an informative college infographic and showcase how infographics can help in effectively communicating these statistics.
Click to jump forward:
Unlocking university statistics with college infographics
Navigating the college application process
The power of university infographics: Showcasing diversity and opportunities
Create a college infographic with Infogram
Share college statistics with ease

Unlocking university statistics with college infographics
In an age where information overload is a real concern, infographics have emerged as a solution to present intricate data in a visually engaging manner. College and university statistics, ranging from admission rates to graduation rates, tuition fees, and student demographics, often can be difficult to understand and analyze. Traditional spreadsheets and dense reports can be overwhelming, leading to confusion and uncertainty.
Enter the college infographic – a visually appealing and effective representation of crucial data points that paints a clearer picture of what universities offer. These infographics employ a combination of images, charts, graphs, and text to convey vital information in a user-friendly format. By breaking down complex statistics into digestible visual components, they empower students to compare and contrast institutions with ease.
Here’s a college infographic example displaying the latest university statistics:
Navigating the college application process
The college application process is one of the most critical turning points in a student’s academic journey. This phase can be overwhelming, especially for high school seniors who are grappling with a multitude of decisions. An insightful college application infographic can be a lifesaver in such instances. From application deadlines and required documents to acceptance rates and average test scores, you can use infographics to present data in a way that fosters comprehension and confident decision-making.
Imagine a student considering two universities with varying admission rates. While numbers might tell one part of the story, an infographic could present the data alongside relatable visuals – perhaps two student silhouettes, one slipping through a narrow door and the other strolling through an open gate. This portrayal succinctly communicates the difference in acceptance rates and imparts a sense of accessibility.
The power of university infographics: Showcasing diversity and opportunities
Universities pride themselves on their diverse and inclusive communities. Highlighting these aspects through comprehensive university infographics can provide students with valuable insights. Demographic breakdowns, representation of international students, and information about clubs and organizations aimed toward cultural exchange can all be effectively communicated through visual representations.
Additionally, infographics can highlight opportunities beyond academics, such as internships, research programs, and other activities. By visually displaying such data, you can emphasize the holistic experience universities offer. This fosters a stronger connection with prospective students who seek not only educational enrichment but also personal growth.
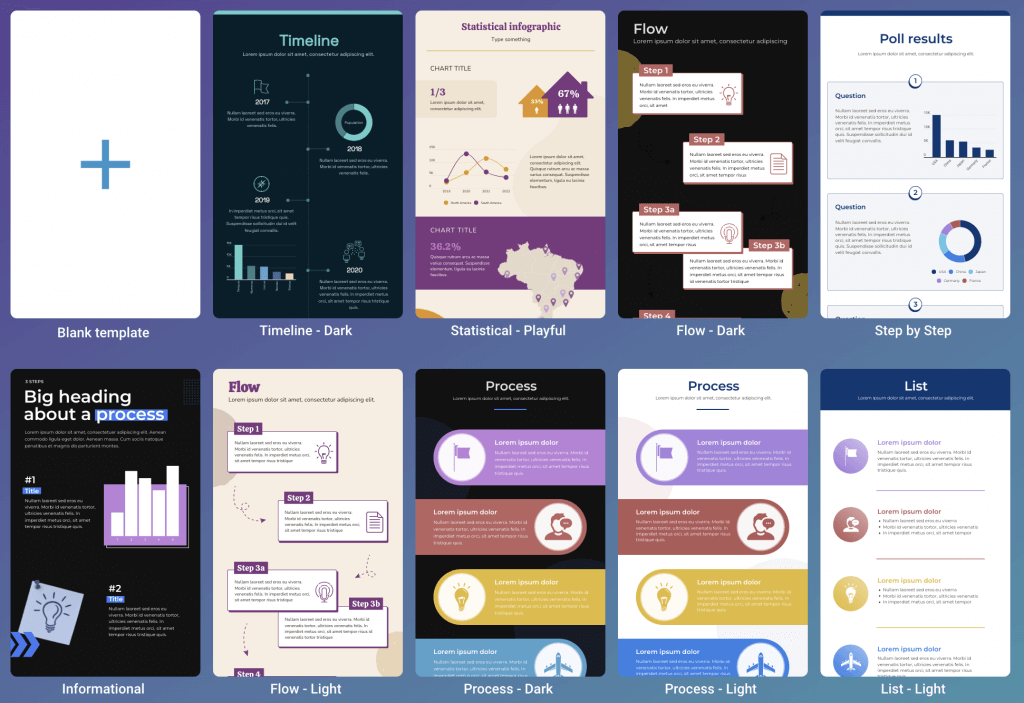
Explore different infographic templates and examples on Infogram that are great for visualizing college statistics:
Create a college infographic with Infogram
Infogram is a great tool for creating college infographics that effectively convey important information to prospective students. Here are some additional points to consider in support of using Infogram for this purpose.
User-friendly interface
Infogram provides an intuitive and user-friendly interface that makes it easy for both beginners and experienced designers to create visually appealing infographics. This is particularly advantageous for students who might not have extensive design experience.
Customizable templates
Infogram offers a wide variety of customizable infographic templates specifically tailored for educational purposes. Whether you want to visualize enrollment numbers, graduation rates, program offerings, or campus facilities, you’ll find templates that can be easily adapted to your data. If you’d like to access the 100+ premium templates Infogram offers, subscribe to the PRO or higher plan.
Interactive data visualizations
Infographics are all about presenting data in a visually engaging manner. Infogram offers a range of interactive charts, graphs, and maps that allow you to present complex statistics in a way that’s easy to understand. This is perfect for showcasing college statistics and making them more accessible to prospective students.
Engagement and retention
Infographics are known for their ability to capture attention and enhance information retention. When college-bound students are presented with attractive and informative visuals, they’re more likely to engage with the content and remember the key points. This can be a great asset during college fairs, orientation events, and on college websites.
Mobile-friendly
In today’s digital age, it’s important to consider the mobile audience. Infogram’s responsive design ensures that your infographics look great and are fully functional on various devices, including smartphones and tablets. This is crucial since many students access information on the go.
Storytelling
Nowadays storytelling is key. And infographics are a great tool for creating and telling a compelling story about your college or university. You can showcase not only statistics but also unique aspects of campus life, extracurricular activities, and the overall student experience. Infogram’s tools allow you to combine text, images, and data to create a cohesive narrative.
Social media sharing
Prospective students are likely active on social media platforms. Infogram makes it easy to share your infographics on various social media channels, enabling you to reach a wider audience and potentially attract more interest to your college.
Branding
Infogram allows you to incorporate your college’s branding elements, such as colors, logos, and fonts, into the infographics. This ensures consistency with your college’s visual identity and enhances brand recognition. If you’d like to access the branding kit functionality, subscribe to the Business or higher plan.
Real-time updates
College statistics may change from year to year. With Infogram, you can update your infographics with the latest data, ensuring that the information you’re presenting is always current and accurate.
Collaboration
Infogram enables multiple users to collaborate on the same project. This can be useful when different departments or teams within the college are responsible for various aspects of the infographic. It streamlines the design process and ensures everyone’s input is considered. If you’d like to access the real-time collaboration functionality, subscribe to the Team or Enterprise plan.
Ultimately, Infogram’s user-friendly interface, customizable templates, powerful data visualization capabilities, and other features make it an excellent tool for creating engaging and informative infographics about colleges and universities. These infographics can play a crucial role in helping prospective students make informed decisions about their higher education journey.

Share college statistics with ease
College and university statistics hold significance for students embarking on their educational pursuits, and infographics are a powerful tool to make sense of these numbers. From simplifying the college application process to showcasing the richness of university life, infographics are great for creating a way for prospective students can engage with higher education data. With that in mind, discover a variety of infographic templates on Infogram and create one today!
Get data visualization tips every week:
New features, special offers, and exciting news about the world of data visualization.