10.08.2016 by Infogram
We all want to incorporate simplicity and efficiency into our work, especially if we are handling data for reports, website analytics, and breaking news coverage. Infogram wants to help you save time and do great work, which is why we offer a wide range of data import options – including live data updates.
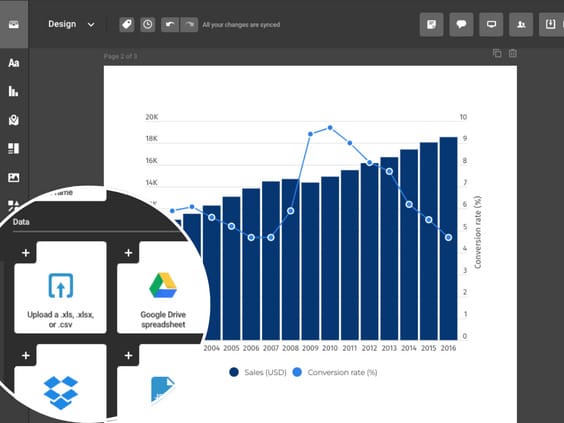
You can copy and paste data into Infogram’s editor, or you can add data first. Choose from the regular sources or use a few integrations to make your life easier. Some options are simple, while others offer more advanced ways to share data.
Import data directly from popular online databases or seamlessly connect to external sources like Google Drive and JSON feeds.

Infogram’s Live Options
It is important to note that live data integration is available to our Pro, Business, and Enterprise users. If you’d like to learn more about our paid plans, click here.
Google Sheets
Infogram’s integration with Google Sheets automates the process of adding new data to a chart by updating the data periodically and automatically. It’s simple to set up, so you might want to use it to update dashboards, reports, presentations, live feeds or articles.
Google Analytics
Connect your Google Analytics account to create a report of your website’s traffic. Create reports by dragging and dropping charts onto an infographic template. Infogram will pull the information from your account and automatically update the charts with your data.
There are 13 different reports to pick from, including top referring sites, mobile usage, number of pages per session, top keywords, and much more.
Explore all live data options
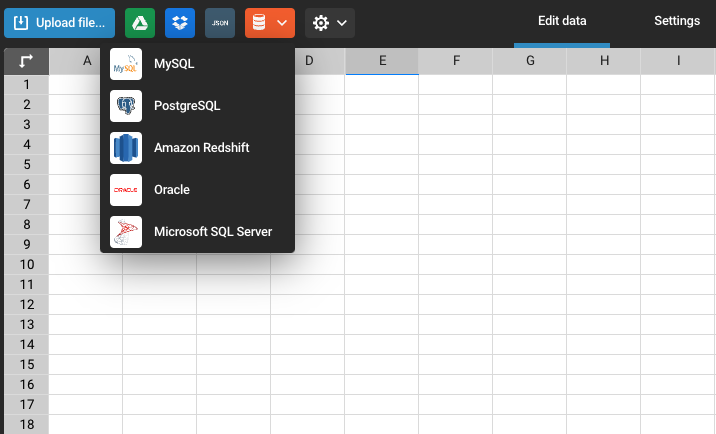
Infogram makes it easy to upload CSV or XLS files from your Google Drive, Dropbox, MySQL, Oracle, and other accounts. Simply connect the desired account, make any design changes you see fit, publish, and embed. You’ll never need to touch the chart or your data again. Discover all options here.
Would you like to experience the full power of data visualization? Try Infogram for Teams or Enterprise for free! With a Team or Enterprise account, you can create up to 10,000+ projects, collaborate with your team in real time, use our engagement analytics feature, and more. Request your free demo here.
To highlight a live data import option, JSON feeds offer real-time server-to-browser communication. JSON is short for JavaScript Object Notation, and is a way to store information in an organized, easy-to-access manner. It uses human-readable text to transmit data objects – and connecting a JSON feed URL to Infogram is a snap.
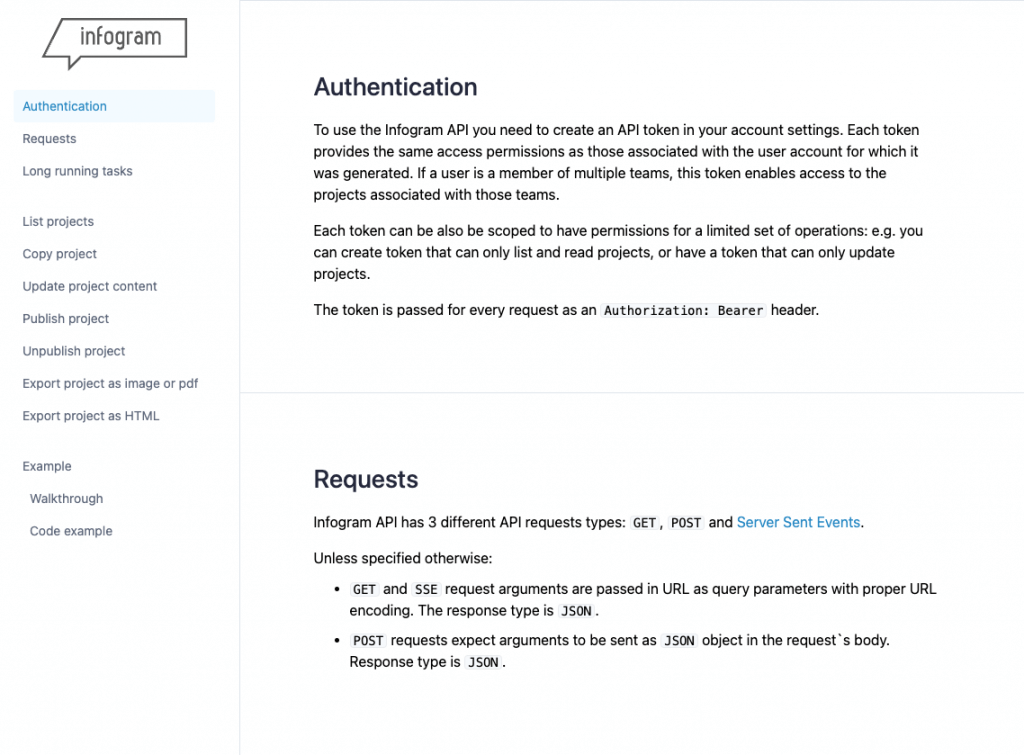
Infogram API
For our more advanced users, the Infogram API provides a streamlined method for incorporating, refreshing, and deploying a variety of visual content, including maps, charts, tables, infographics, reports, and interactive dashboards.
API is a powerful tool for streamlining visualization workflows. By automating routine tasks like creation and updates, it frees up valuable time for you to focus on data analysis and storytelling. Its scalability is another key advantage, enabling efficient handling of large-scale projects and frequent updates across multiple visualizations. This makes it an ideal solution for enterprises requiring high-volume report and dashboard generation, significantly boosting overall operational efficiency. Learn more about Infogram’s API here.
Additionally, have a deeper look exploring the API documentation.
Reminder: Live-updates work when a project is published, either on web-view or via embed. It updates the data when the graph loads and then every 30 seconds or other time interval you’ve specified.
Leverage the full potential of data
Infogram’s live data import options offer an innovative solution for anyone seeking to create dynamic and informative visualizations. By easily integrating real-time data into your visuals, you can make data-driven decisions with speed and accuracy. The ability to transform raw data into actionable insights empowers you to stay ahead of trends, identify opportunities, and communicate effectively. As data continues to grow in volume and complexity, Infogram’s live data import functionality becomes a valuable tool for anyone looking to leverage the full potential of their data.

Get data visualization tips every week:
New features, special offers, and exciting news about the world of data visualization.