08.11.2017 by Infogram
Take the guesswork out of designing your next visualization with Infogram’s beautiful new templates. The completely re-designed version of Infogram comes equipped with expert layouts ideal for reports, infographics, dashboards, and social media posts.
Would you like to experience the full power of data visualization? Try Infogram for Teams or Enterprise for free! With a Team or Enterprise account, you can create up to 10,000+ projects, collaborate with your team in real time, use our engagement analytics feature, and more. Request your free demo here.
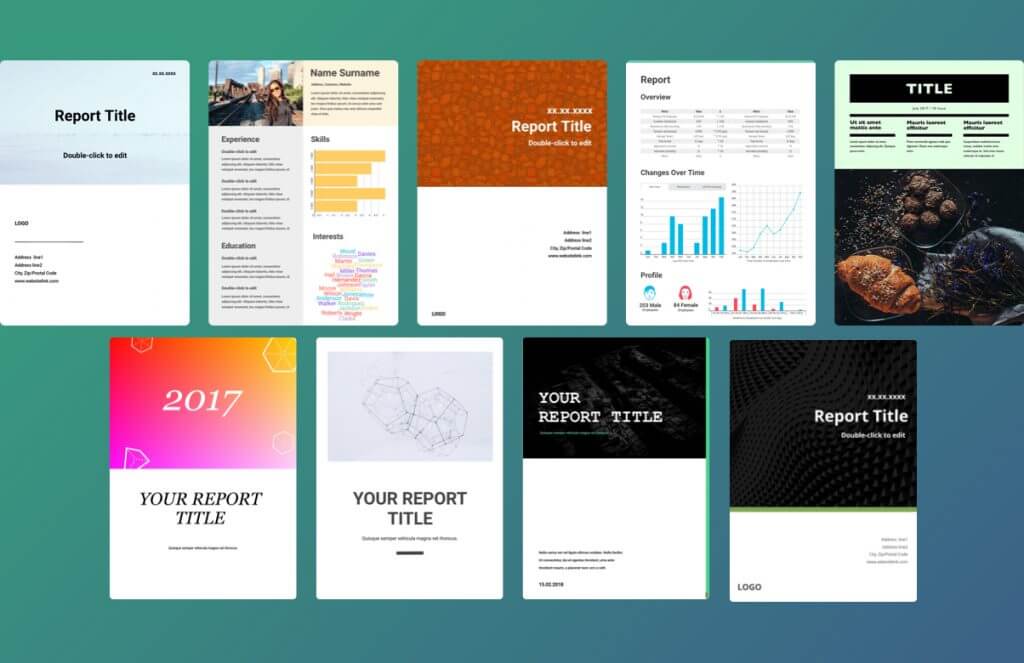
Reports
Take your reports from dull to delightful with a wide-variety of report templates. Our reports are guaranteed to impress your bosses, teachers, and co-workers. We highly encourage you to explore our selection of playful, professional designs.

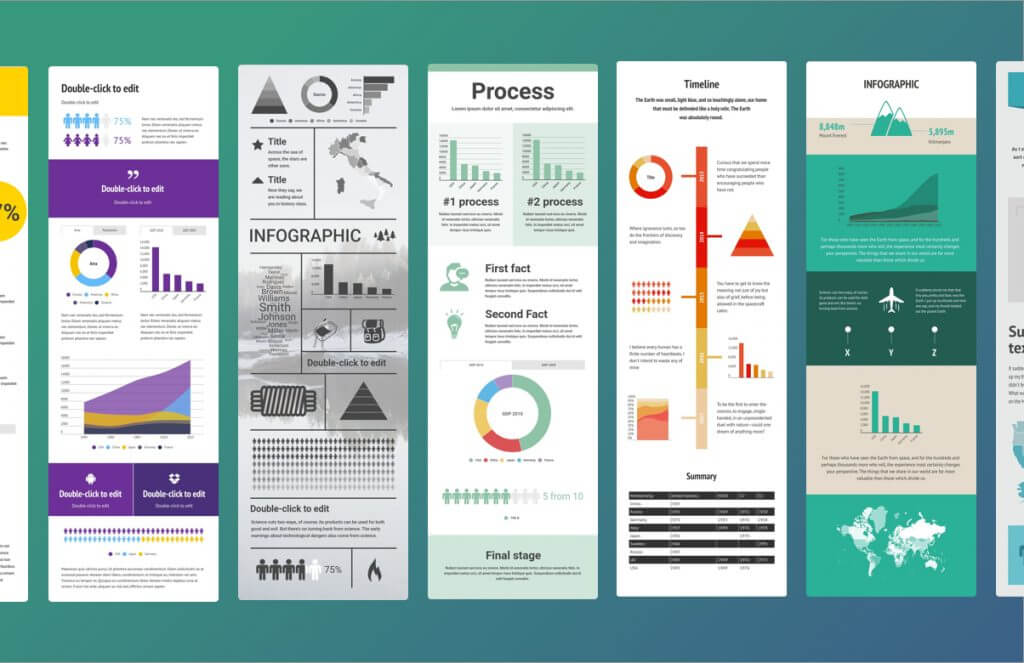
Infographics
Infographics are a great way to share data, visuals, and text – all in one cohesive visual story. But, building an infographic from scratch is no easy task, which is why our infographic templates are your new best friend. Quickly create historical timelines, step-by-step processes, how-to guidelines, and data-centric infographics.

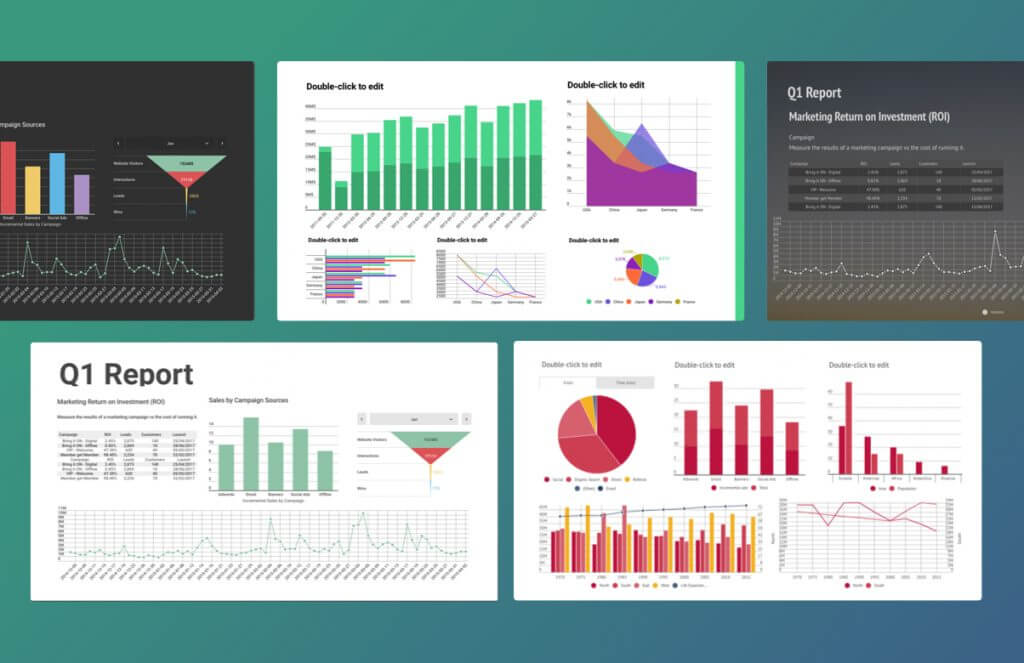
Dashboards
Dashboards give a quick high-level overview of a company, displaying key metrics and overall trends. Pick the dashboard template that works best for your data. You can even set up live data so your dashboards update automatically wherever you’ve embedded.

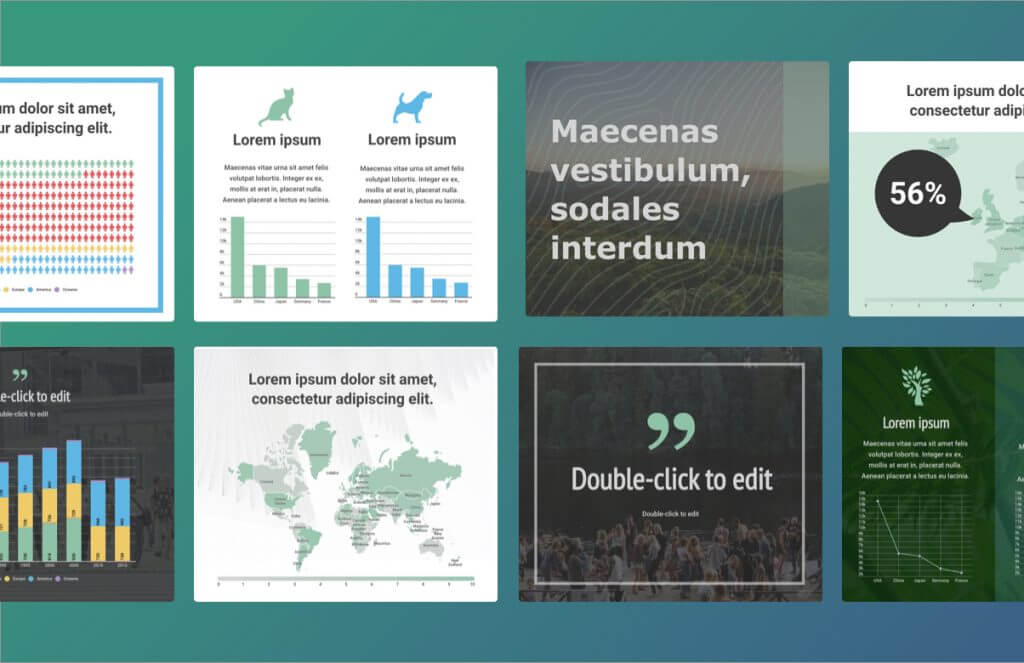
Social Media
Social media posts featuring relevant images are liked and shared more than those without! Don’t worry, designing social images is easy. Infogram offers the perfect size and format for Facebook, Twitter, Instagram, Pinterest, and more. Simply pick a template and layer images, text, shapes, and charts to ‘wow’ your followers.

You can quickly make Infogram’s templates your own. With access to 550 maps, more than 37 charts, and over one million ready-to-use images and icons – customization is a snap. Sign up or log in to Infogram to try our new templates and flexible editor.
Get data visualization tips every week:
New features, special offers, and exciting news about the world of data visualization.