24.10.2017 by Infogram
Since 2012, Infogram has been dedicated to increasing data literacy around the world, helping people visualize and share data. Now, over 3 million people use Infogram to create incredible charts and infographics that let them communicate visually and tell better data-driven stories.
Today, we’d like to introduce you to the latest version of our award-winning data visualization platform. It’s the most powerful, versatile Infogram yet – complete with the same high-impact charts and maps you love.
New Design Experience
Our intuitive, flexible drag-and-drop editor lets you place elements freely in your project. Elements that you can resize, overlap, and combine to create stunning visuals in minutes. Simply drop in charts, maps, photos, videos, icons, GIFs, text, and shapes anywhere you’d like.
Beautiful Templates
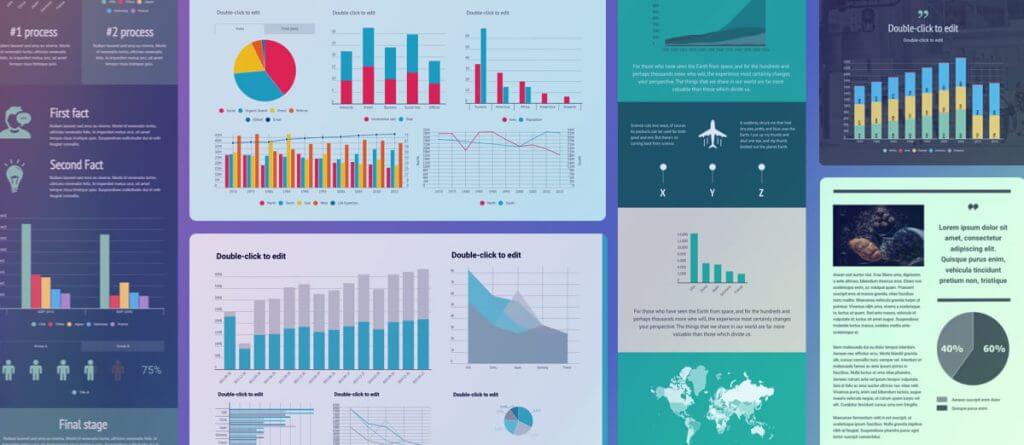
Enjoy over 40 designer templates, which make it easy to turn ideas and data into engaging content. Our templates help teams quickly create interactive multi-page reports, dashboards, infographics, and social media images.
Social Media Assets
Infogram offers the perfect size and format for Facebook, Twitter, Instagram, Pinterest, and more. Once you’ve finished, you can share your projects directly to social media from Infogram, or download them as images or animated GIFs – perfect for posts.
Watch the video below to see how the new Infogram can work for you.
It’s never been easier to visualize, customize, and share your data. Give it a try from your Infogram account today! We know you’re going to love it.
Get data visualization tips every week:
New features, special offers, and exciting news about the world of data visualization.