08.08.2018 by Infogram
There is a reason bar charts are so common; they’re capable of visualizing most datasets and our brains love them. Our eyes can quickly compare lengths and judge distances, making bar and column charts (which feature vertical bars) both simple and highly effective. Chances are you’ve seen them in news articles, business reports, presentations, textbooks, survey results, infographics — everywhere.
But, that doesn’t mean designing a great bar chart is easy. Here’s what to do, and what not to do, when making your own.
Clear, Organized Axes

The x-axis and y-axis are the backbone of your bar chart. Don’t start the axis at a value above zero. When you start your axis above zero, you shrink the bars and skew the way your data looks, often confusing the viewer and robbing them of context. You also want to avoid gaps in between your bars that are uneven or too large. This can be a result of poor design or an axis that isn’t scaled evenly.
Do This: Once you’ve set your origin to start at zero, make sure your axes are scaled evenly. The spaces in between your bars should be uniform and consistent. If the data isn’t in chronological order, place the bars in order by size.
Consistent, Defined Colors
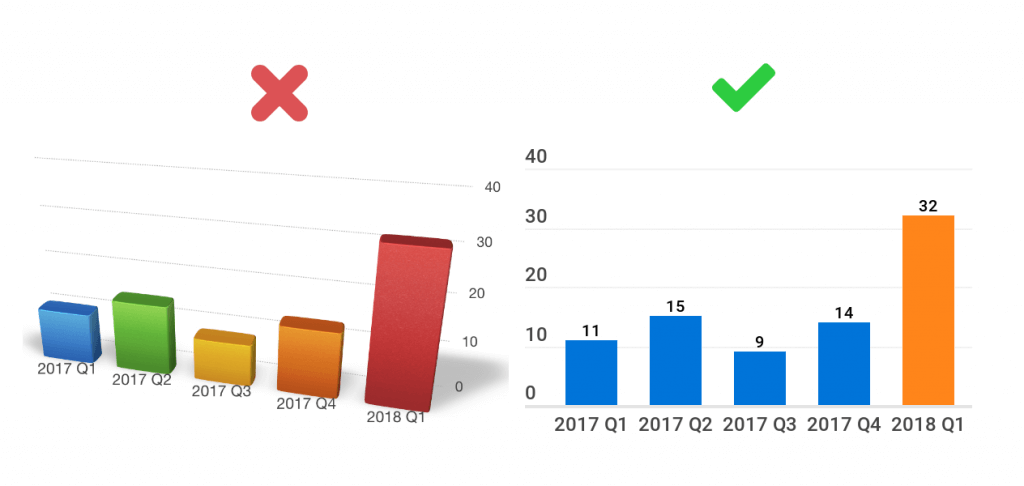
Color is very important when designing an effective bar chart. Color has the power to enhance the way your chart conveys your message, but when used incorrectly, color can confuse the viewer and distract from your goal. Avoid the rainbow effect; while a variety of colors might look cool, it generally makes charts hard to understand. And, avoid 3D imagery at all costs! The end result makes your data too hard to decipher.
Do This: Pick one color for your entire chart. Or, you can use a muted neutral tone featuring a pop of color to draw attention to the most important aspect of your data. This is a great way to use color to help people draw conclusions more quickly. If you’re making charts for a branded piece of content, use company colors for a polished look.
Clean, Easy-to-Read Labels
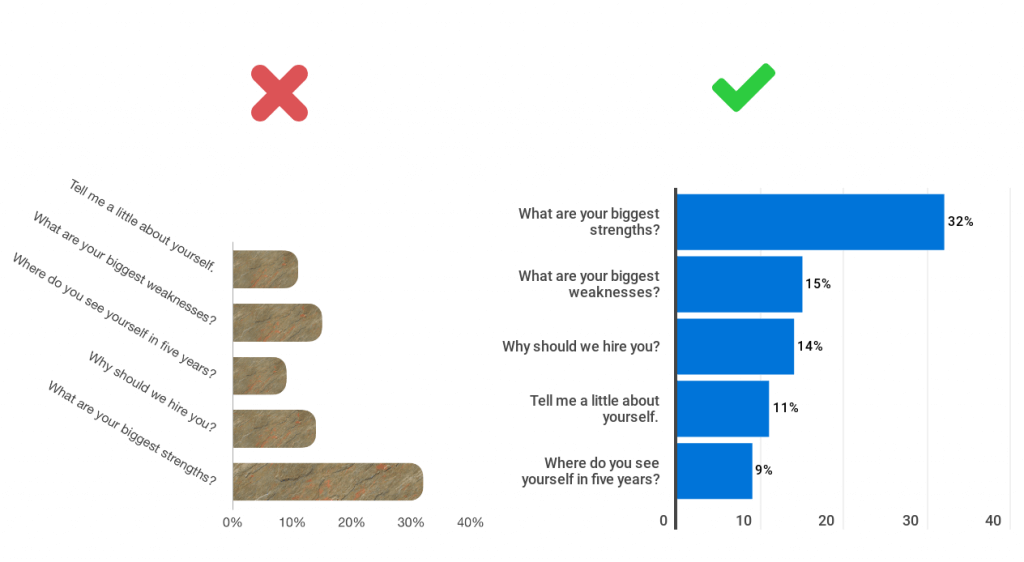
Thoughtfulness matters when deciding where to place text in and around your bar chart. Don’t label your bars with vertical text. This forces the viewer to crane their neck sideways to see what your chart is about. Don’t skip the title, and avoid fonts that are too small for your viewer to read.
Do This: The beauty of a bar chart is that the bars are horizontal, so your labels should be horizontal as well for easy reading. Because the bars are horizontal your labels can be a little longer, which is hard when using a column chart that features vertical bars. Give your chart a clear and engaging title, and make sure your font is big enough for people to read and comprehend.
Bar Chart Alternatives
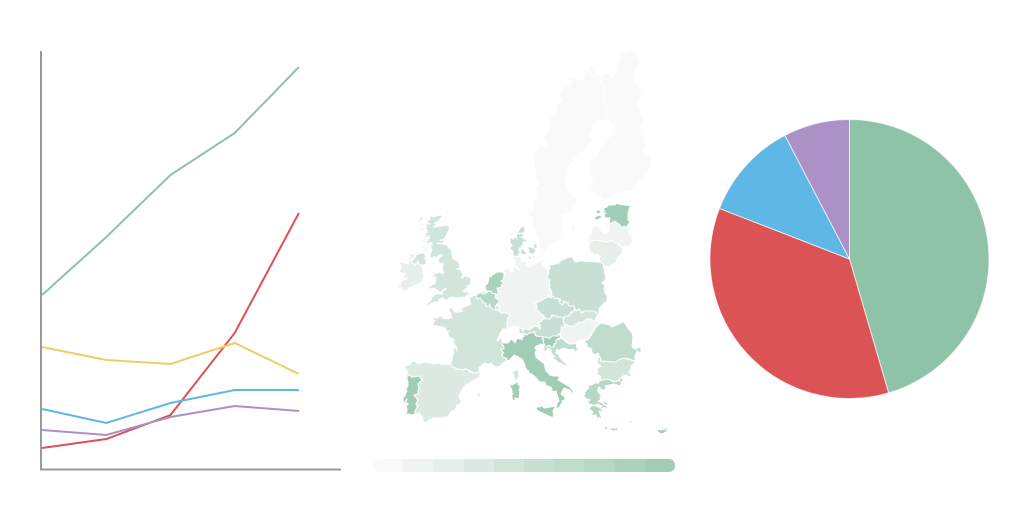
Sick of bar charts? There are a few alternative charts you can try.
If you’re showing change over time, plug your data into a line chart. If you’re showing parts of a whole (adding up to 100%), experiment with a pie chart. If your data is geographical, you might want to take the time to design a map. That being said, if you feel you’re losing any part of your message after switching charts, go back to the classic bar chart. There’s a reason they’re at the top of the data visualization food chain.
Would you like to experience the full power of data visualization? Try Infogram for Teams or Enterprise for free! With a Team or Enterprise account, you can create up to 10,000+ projects, collaborate with your team in real-time, use our engagement analytics feature, and more. Request your free demo here.
This post is a part of Infogram’s ‘Do This, Not That’ series – offering insight and best practices for the world’s most common chart types. If you found this useful, you may want to check out more posts in this series:
Interested in discovering how Infogram can enhance your team’s work? Join a brief Zoom session with our Infogram representative to explore key features, get answers to your questions, and understand how we can assist. It’s quick, informative, and just like a coffee break chat. Schedule your call now!
Get data visualization tips every week:
New features, special offers, and exciting news about the world of data visualization.