
Create Interactive Data Visualizations with AI
Create Infographics, Charts and More • Share & Embed Anywhere • AI Powered
Empowering Creators Like You
All examples
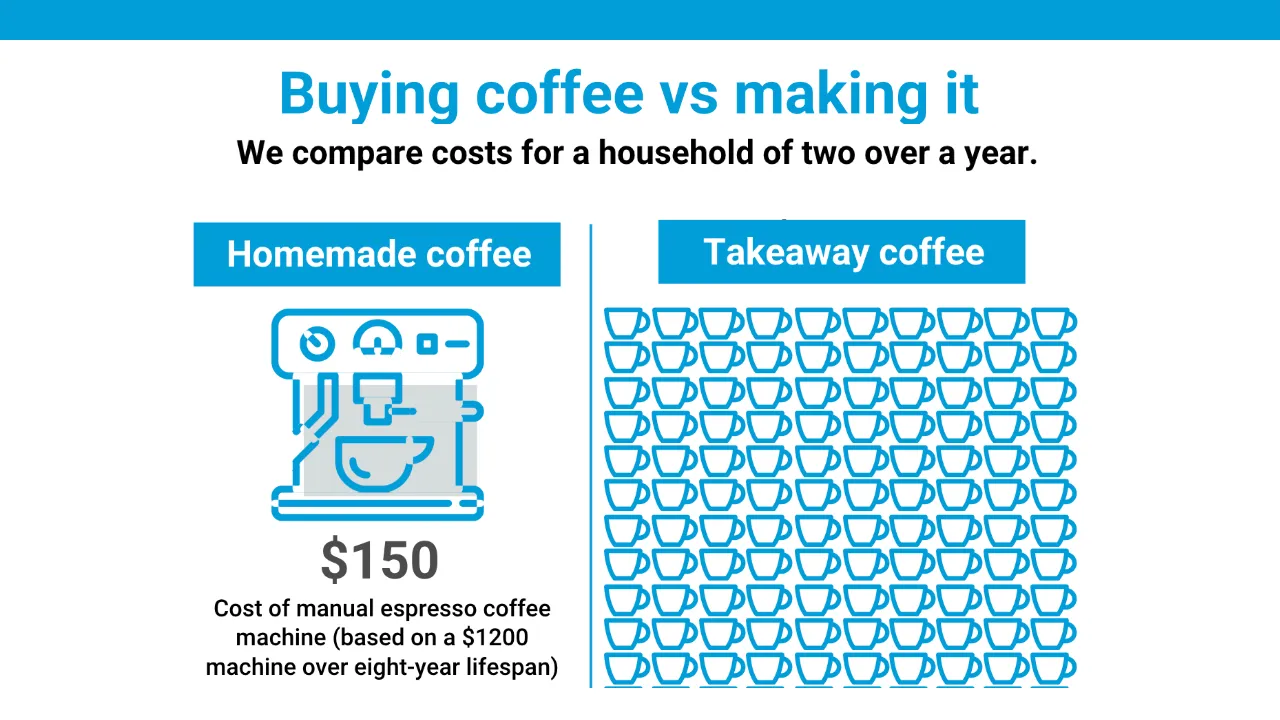
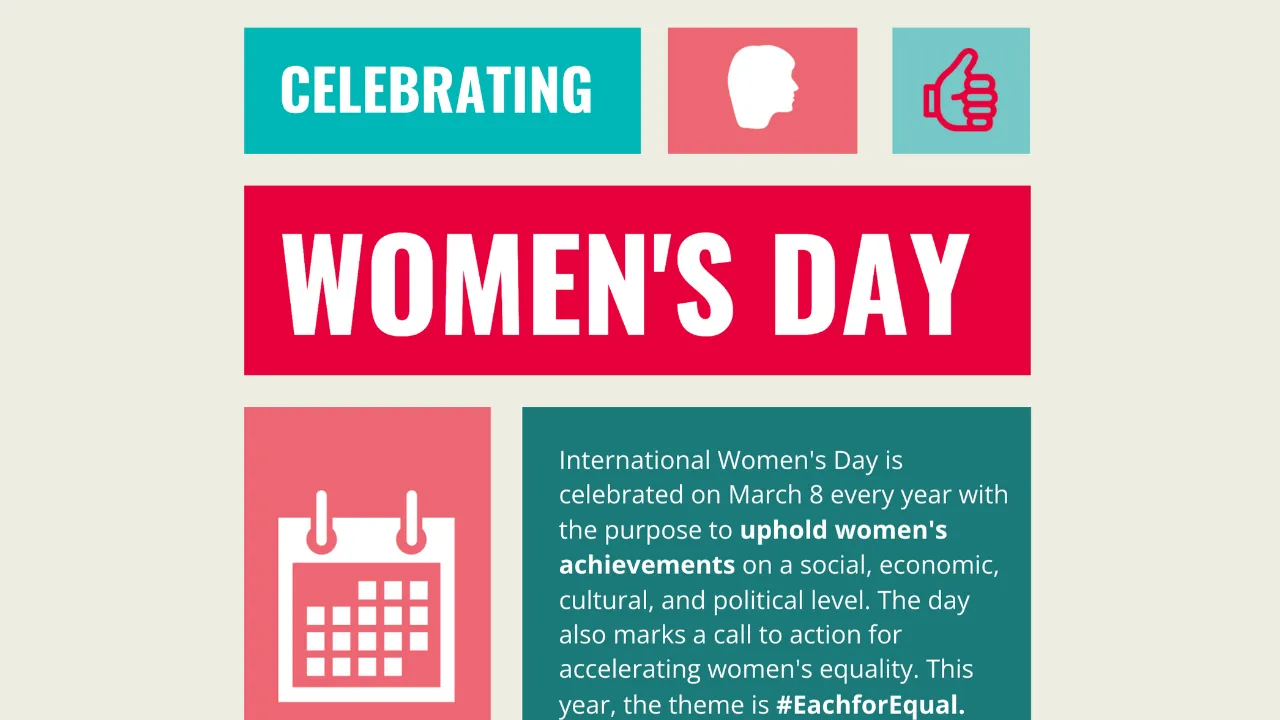
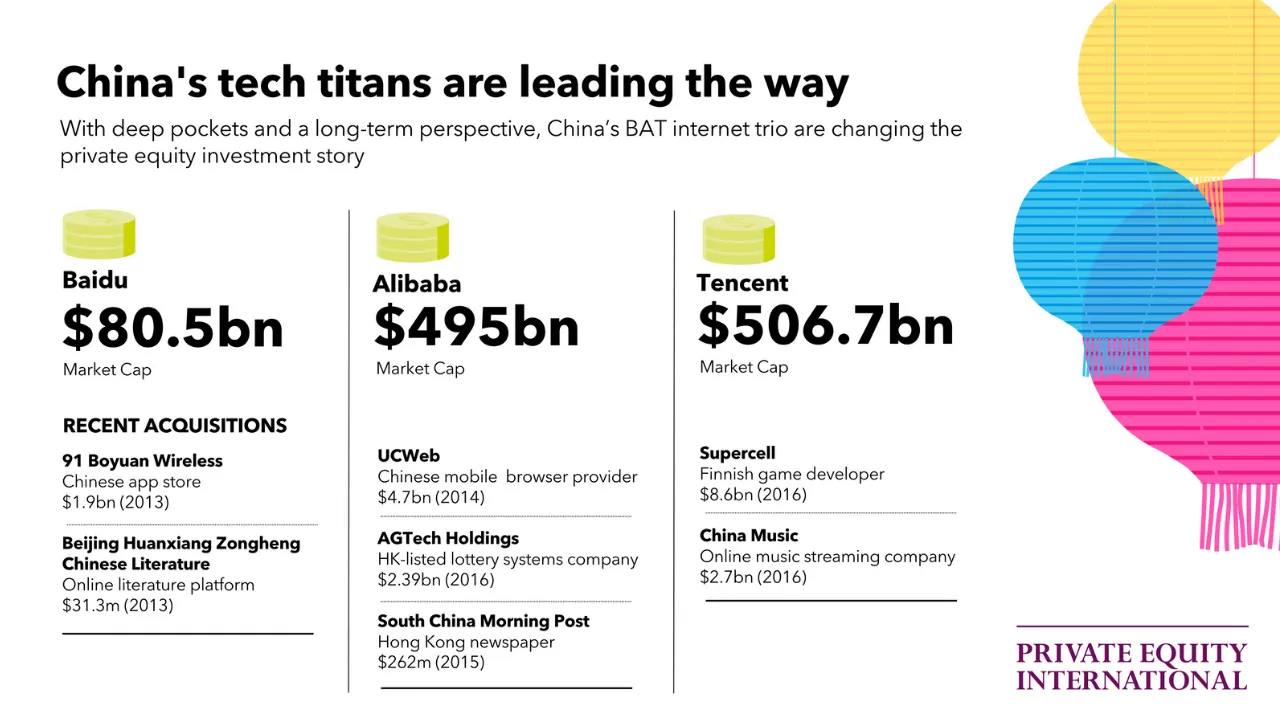
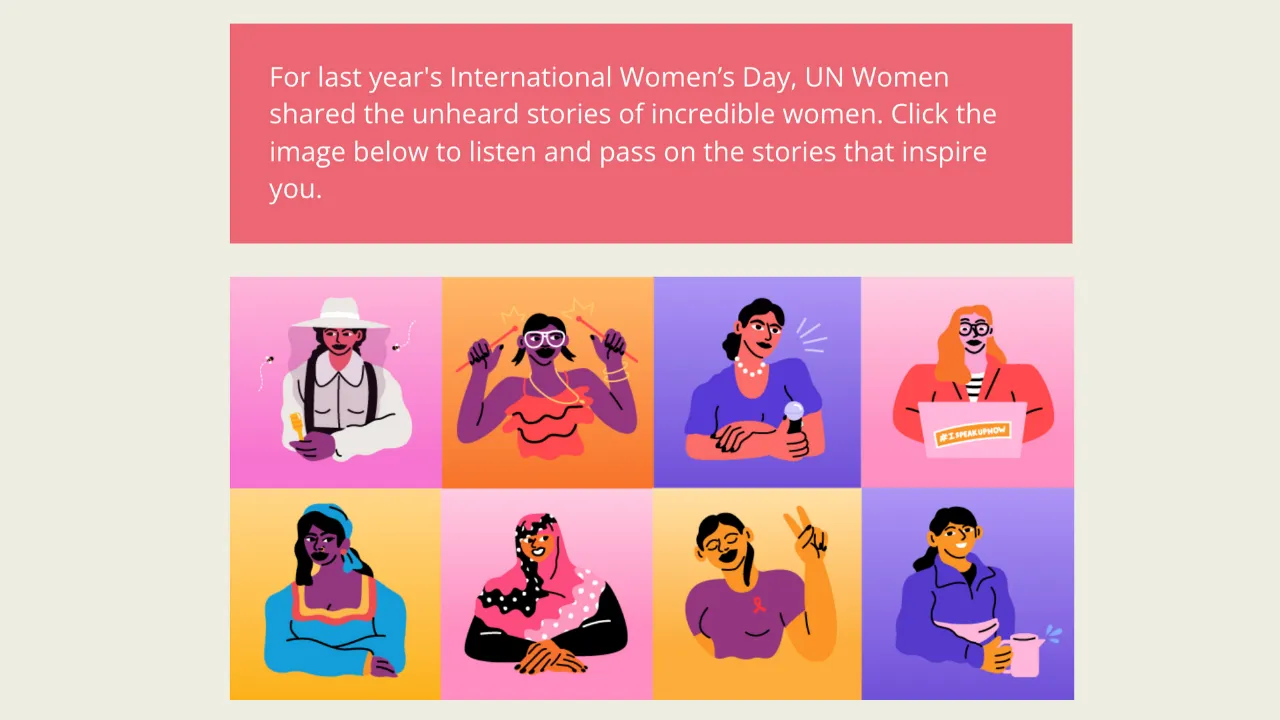
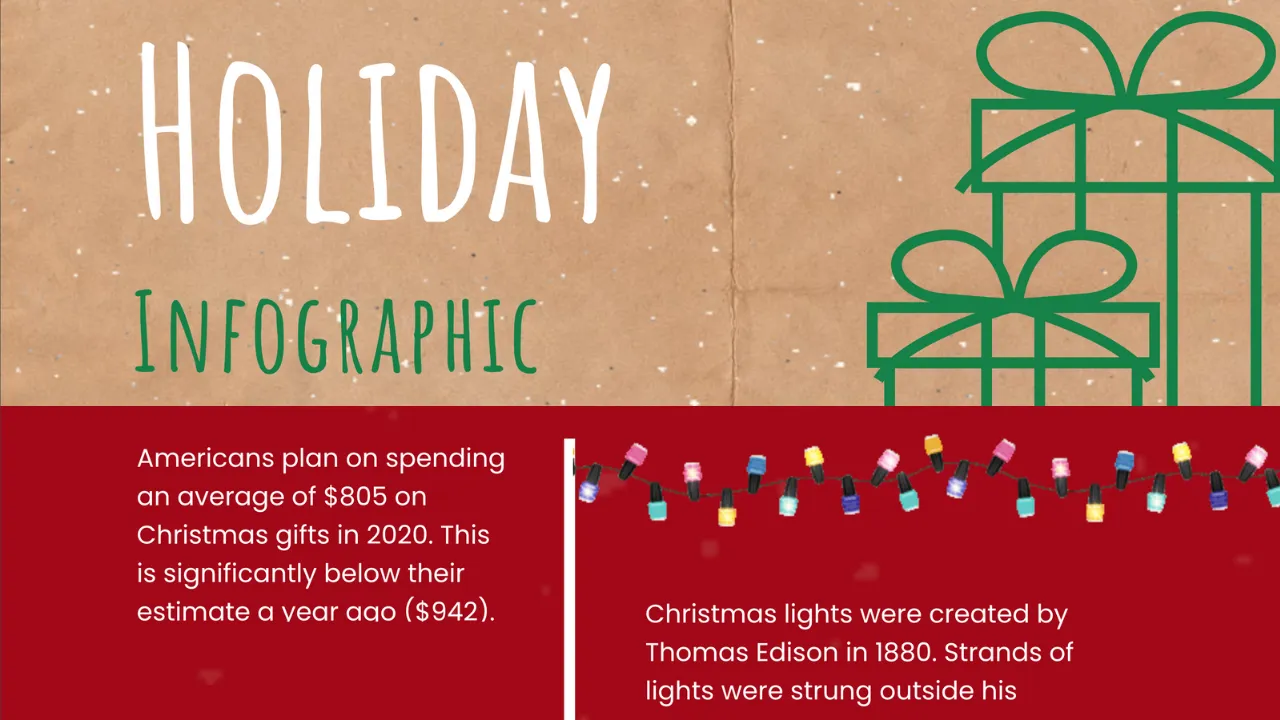
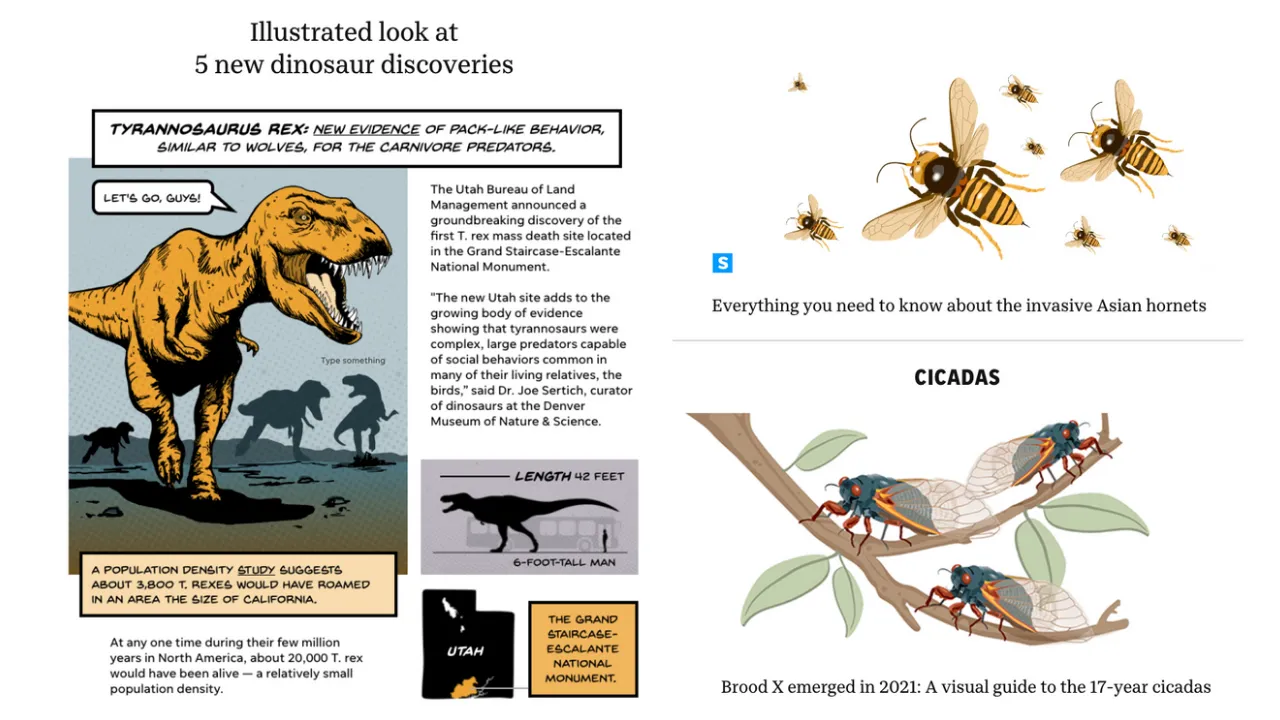
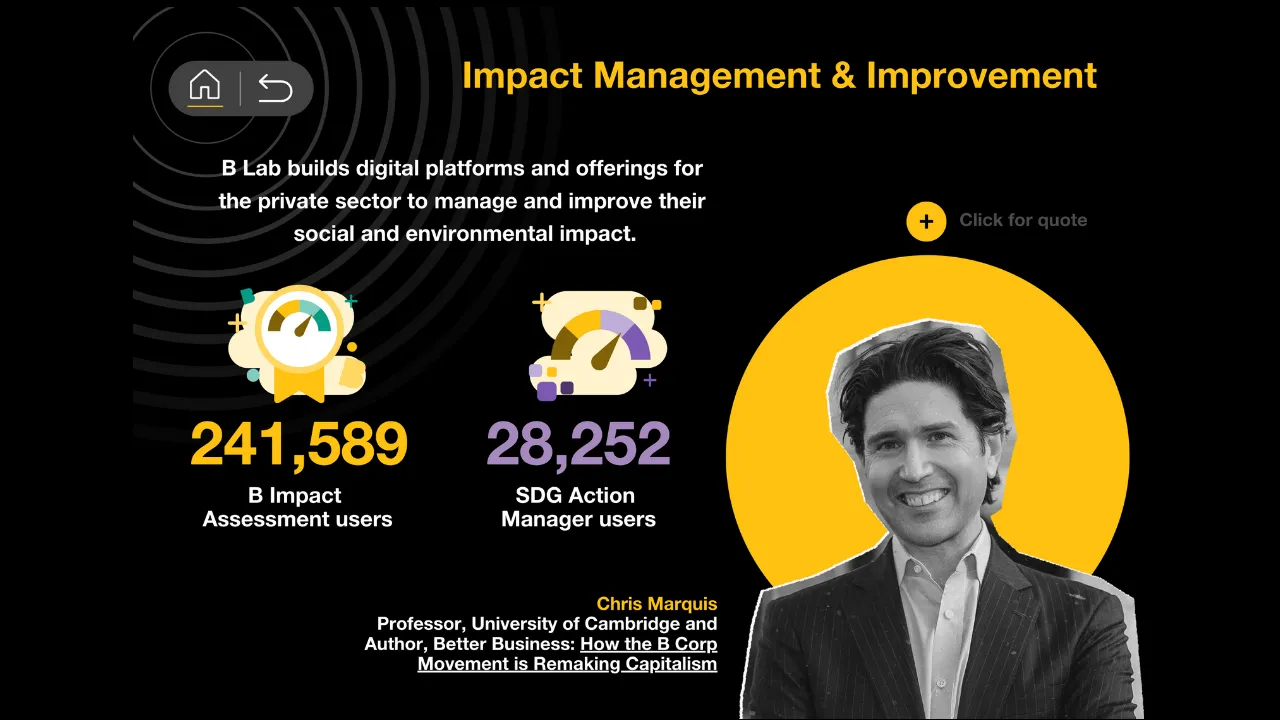
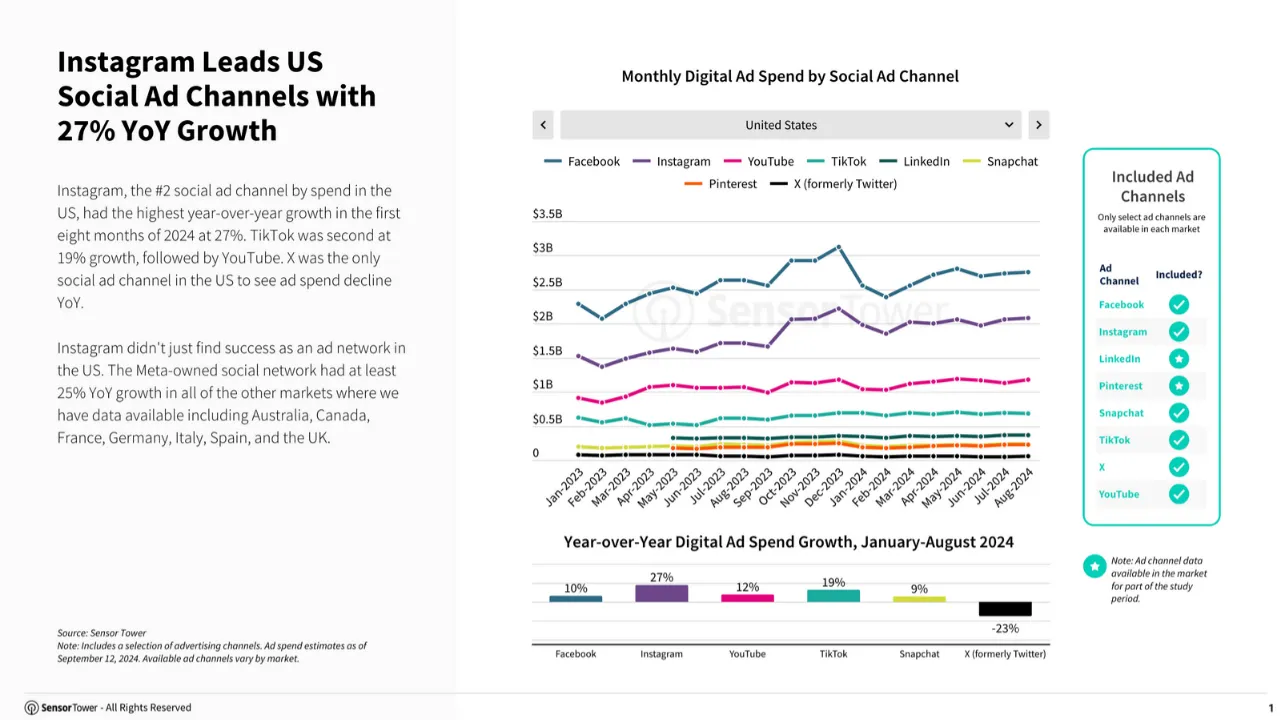
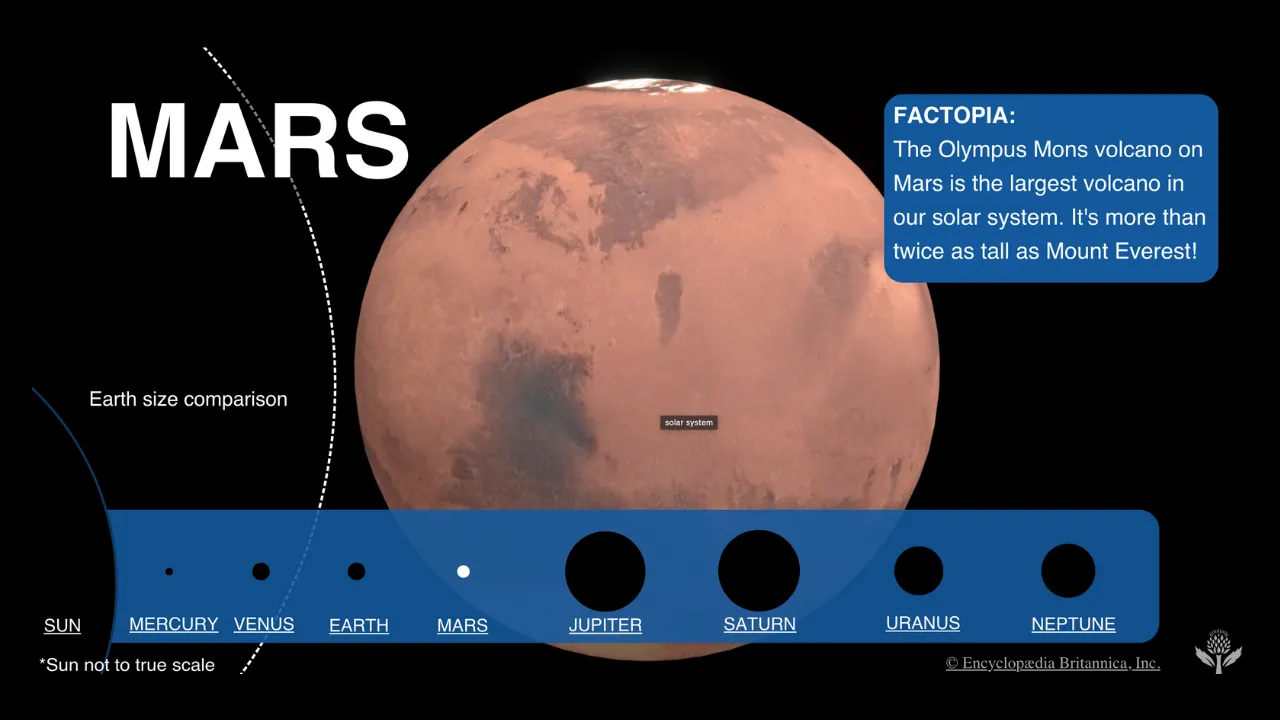
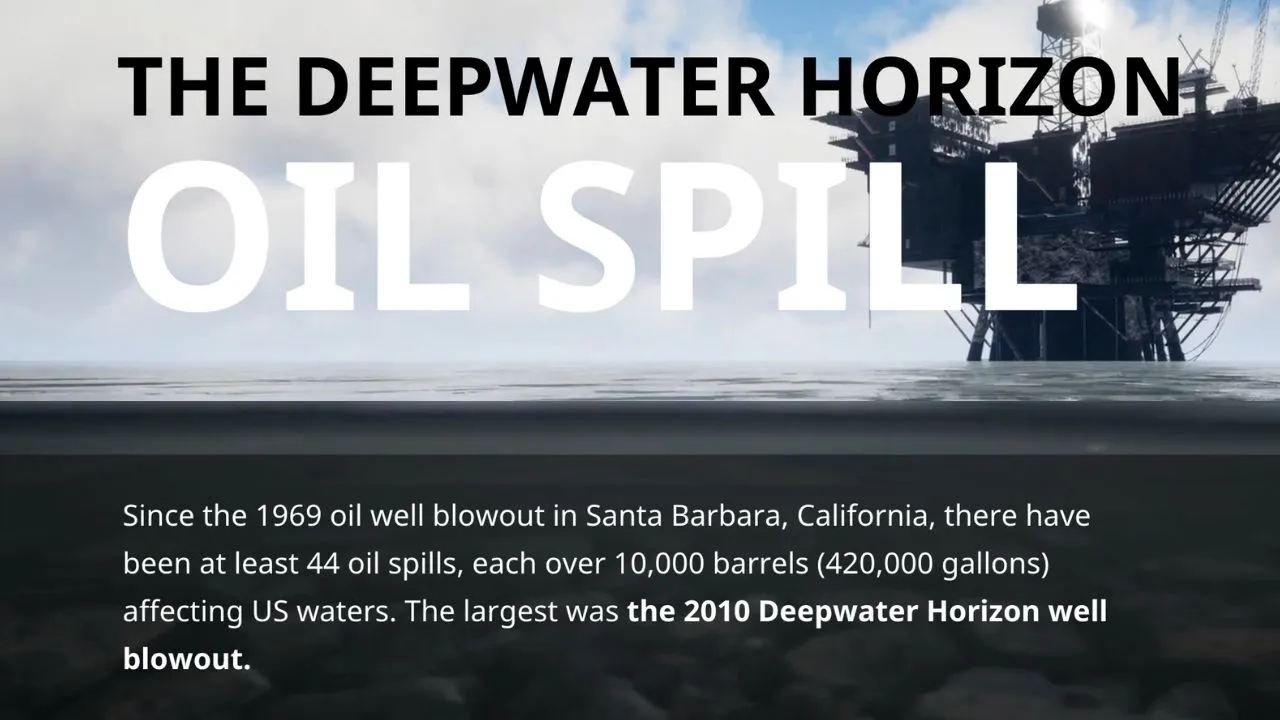
Infographics
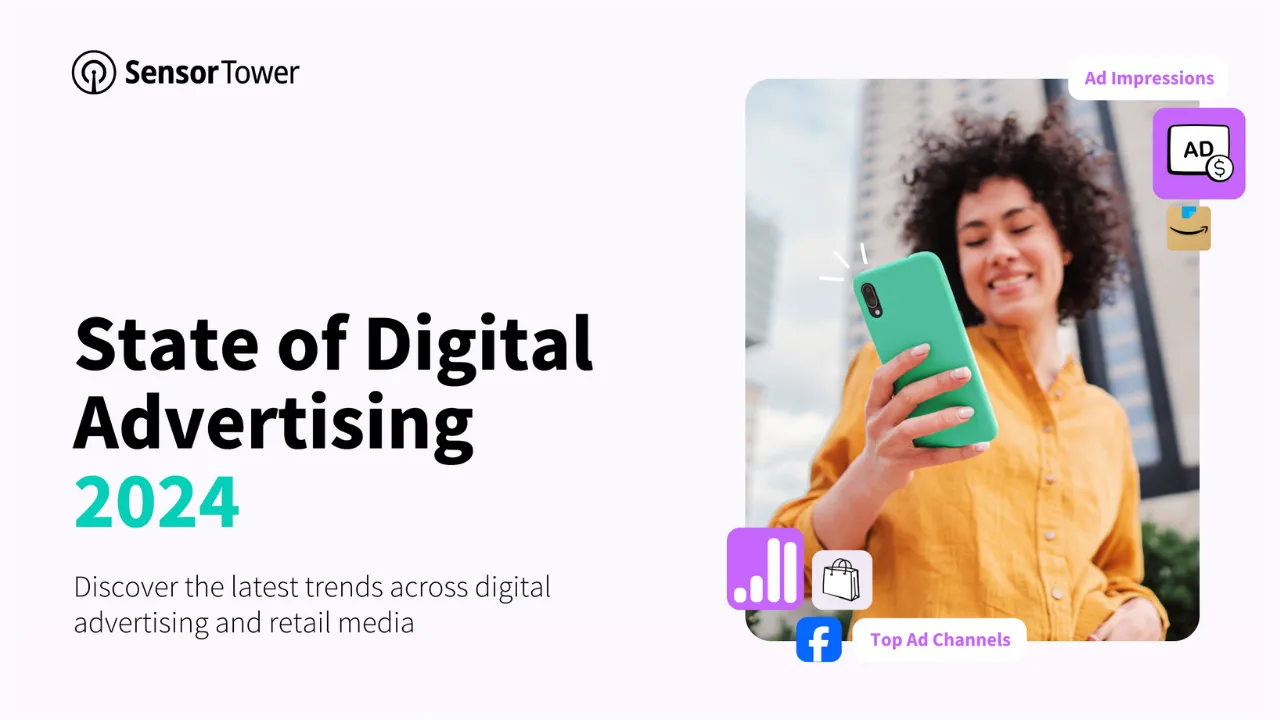
Reports
Dashboards
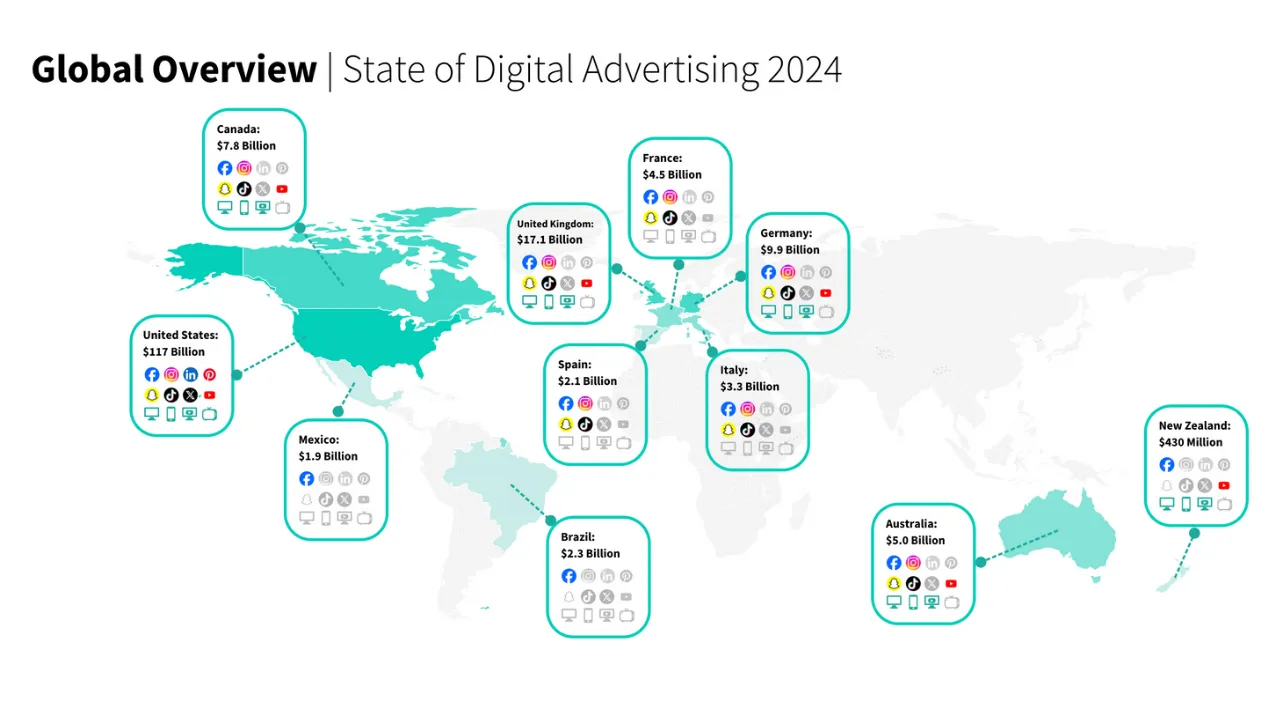
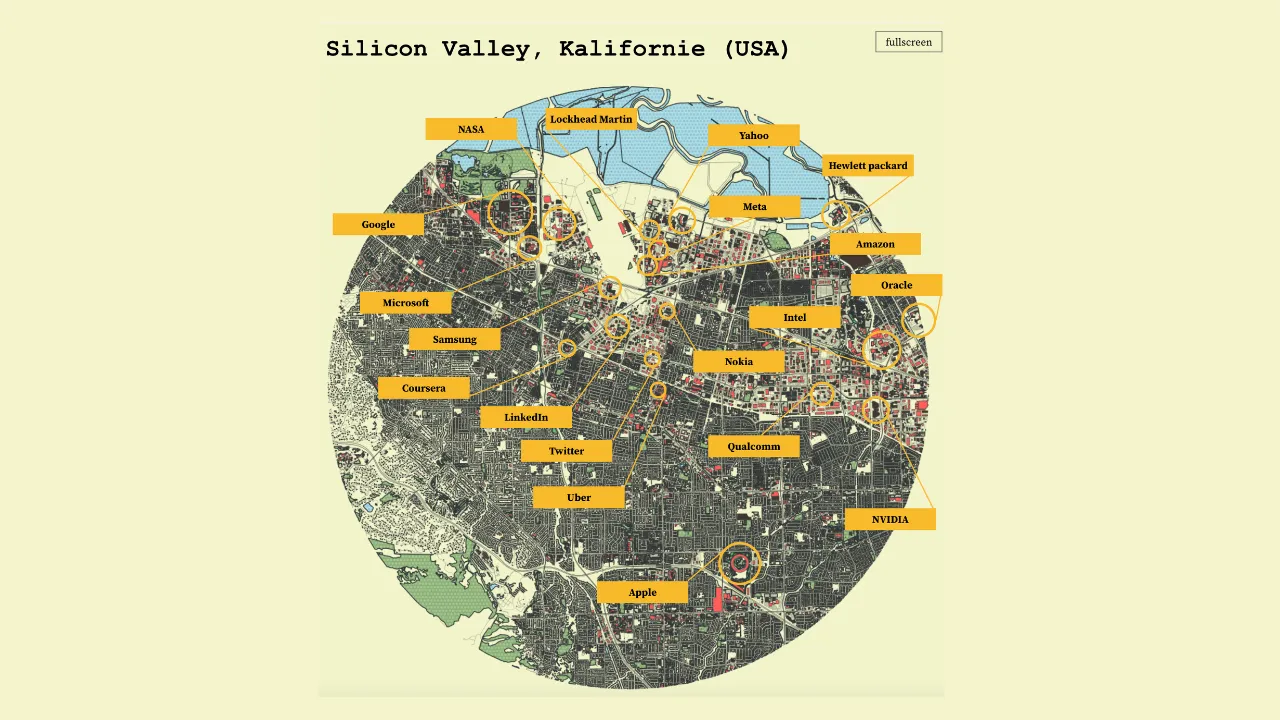
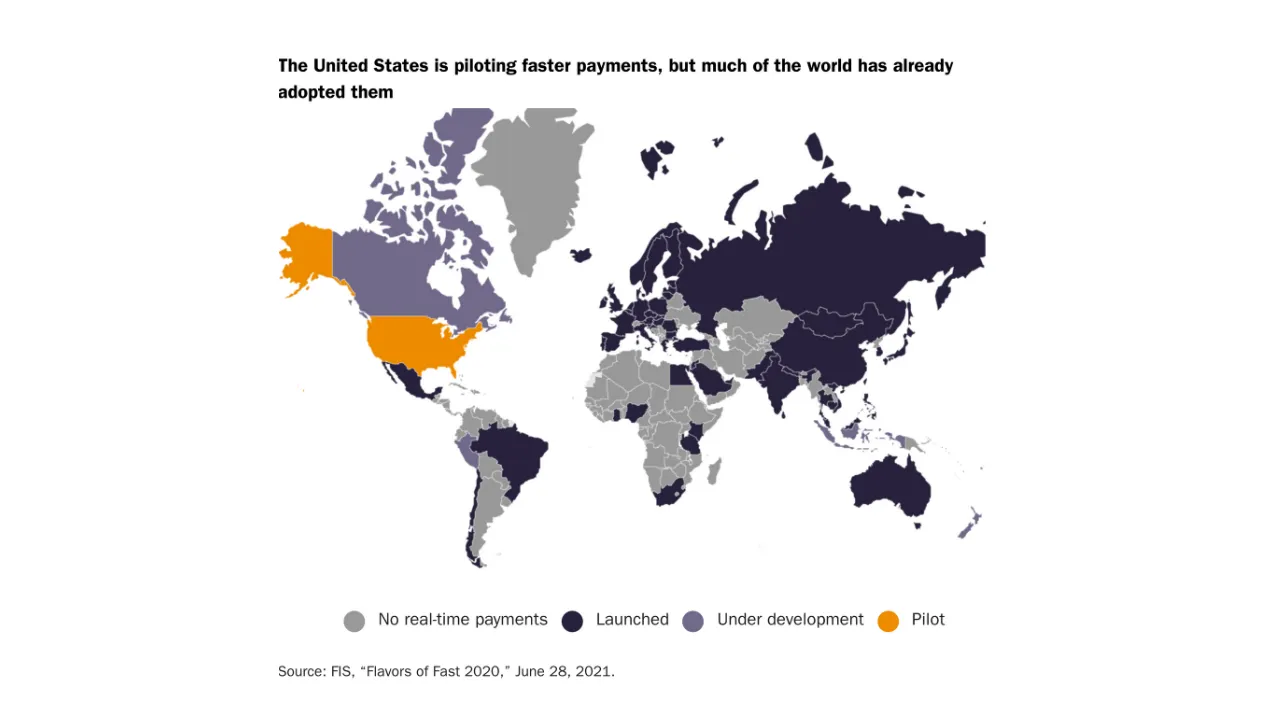
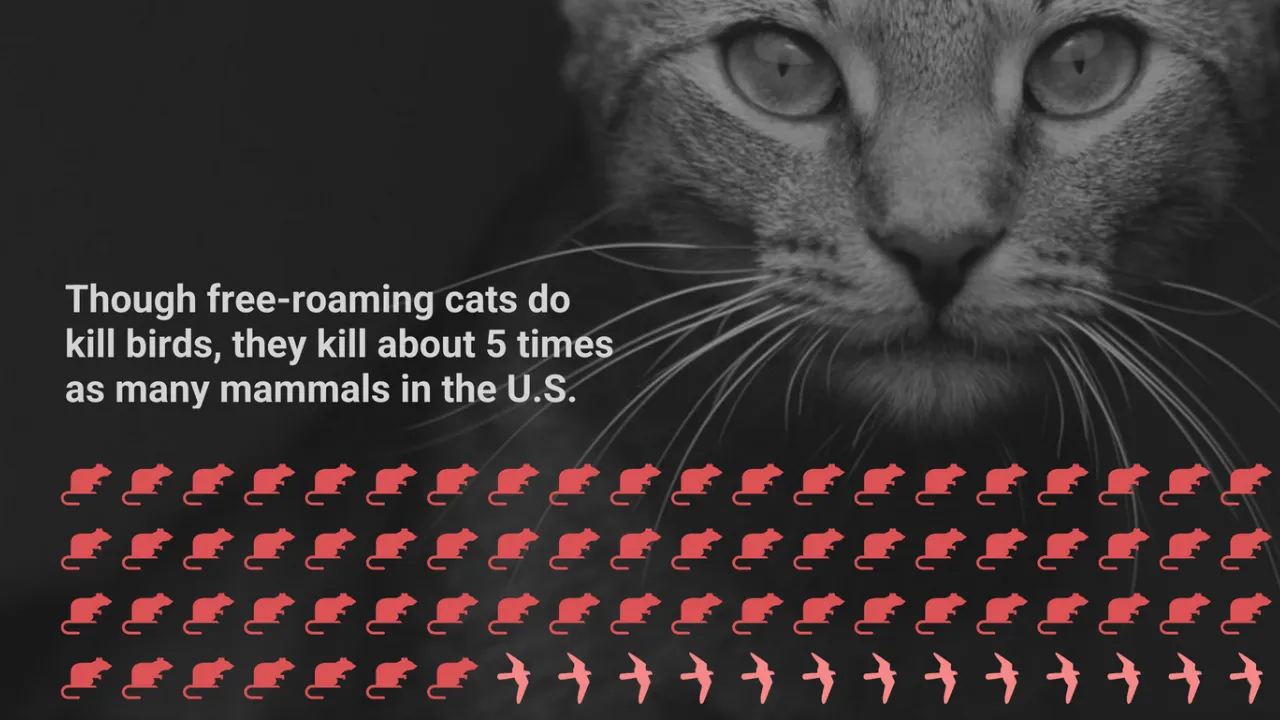
Maps
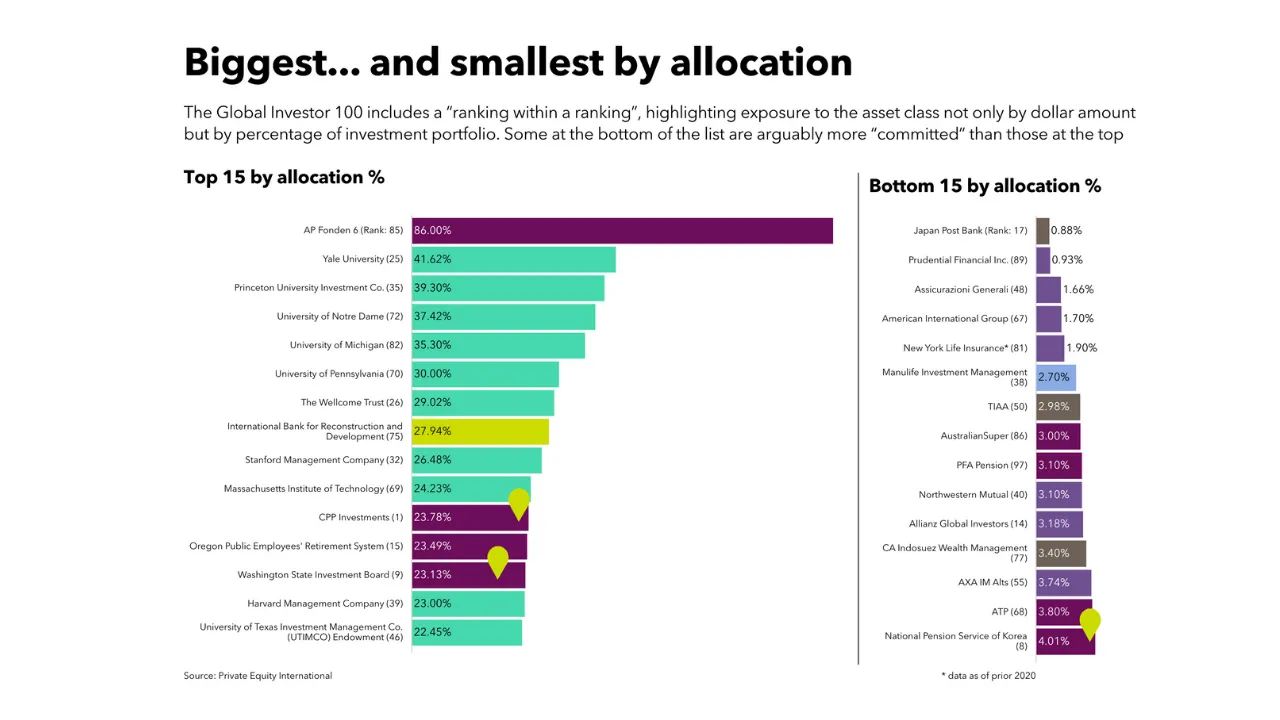
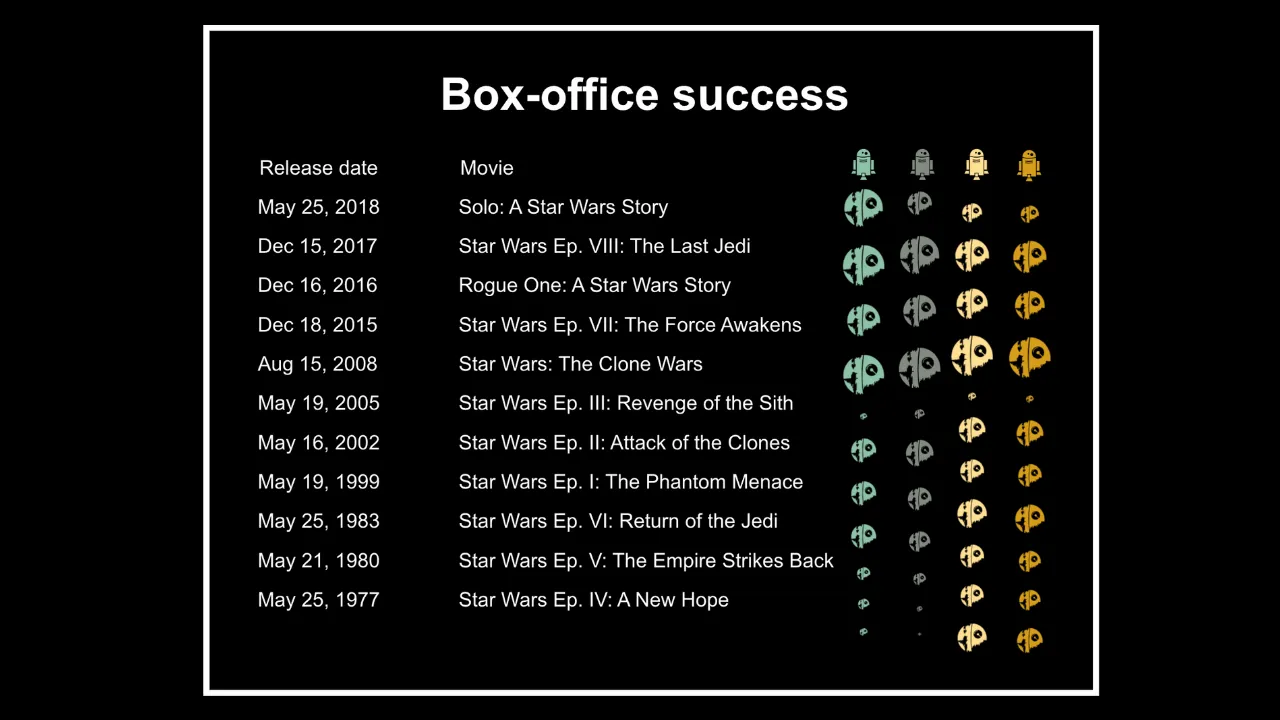
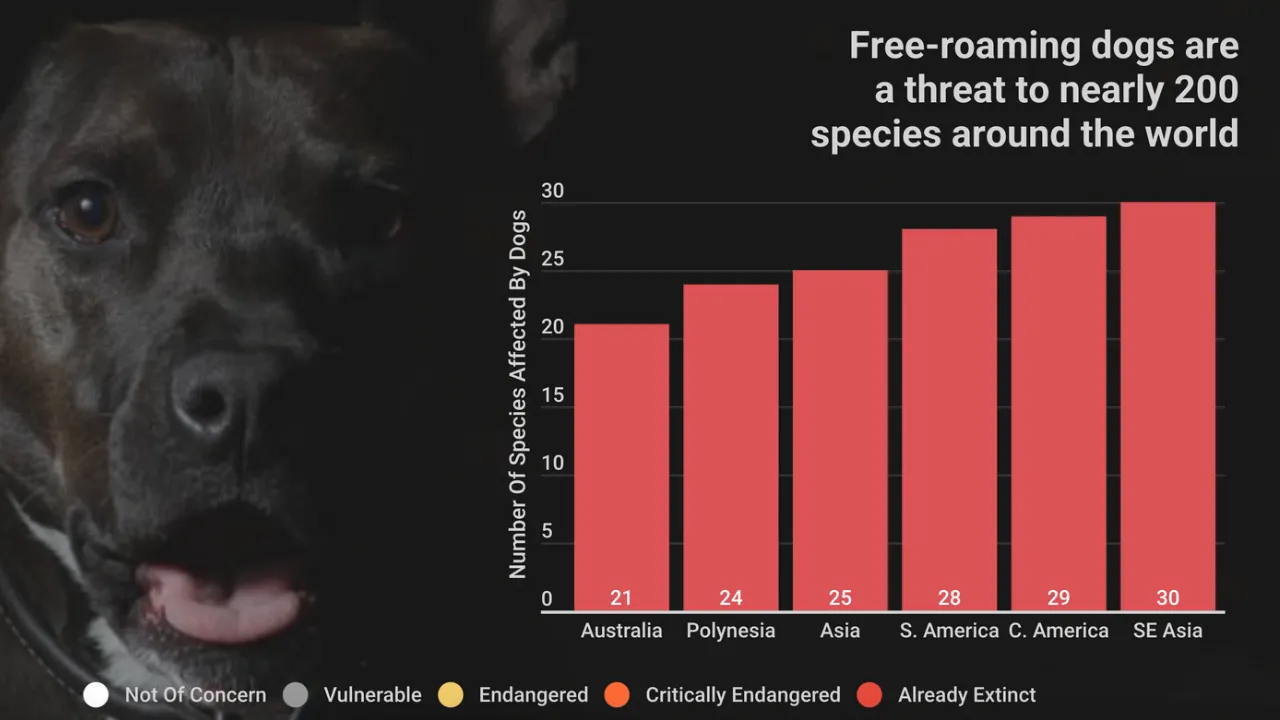
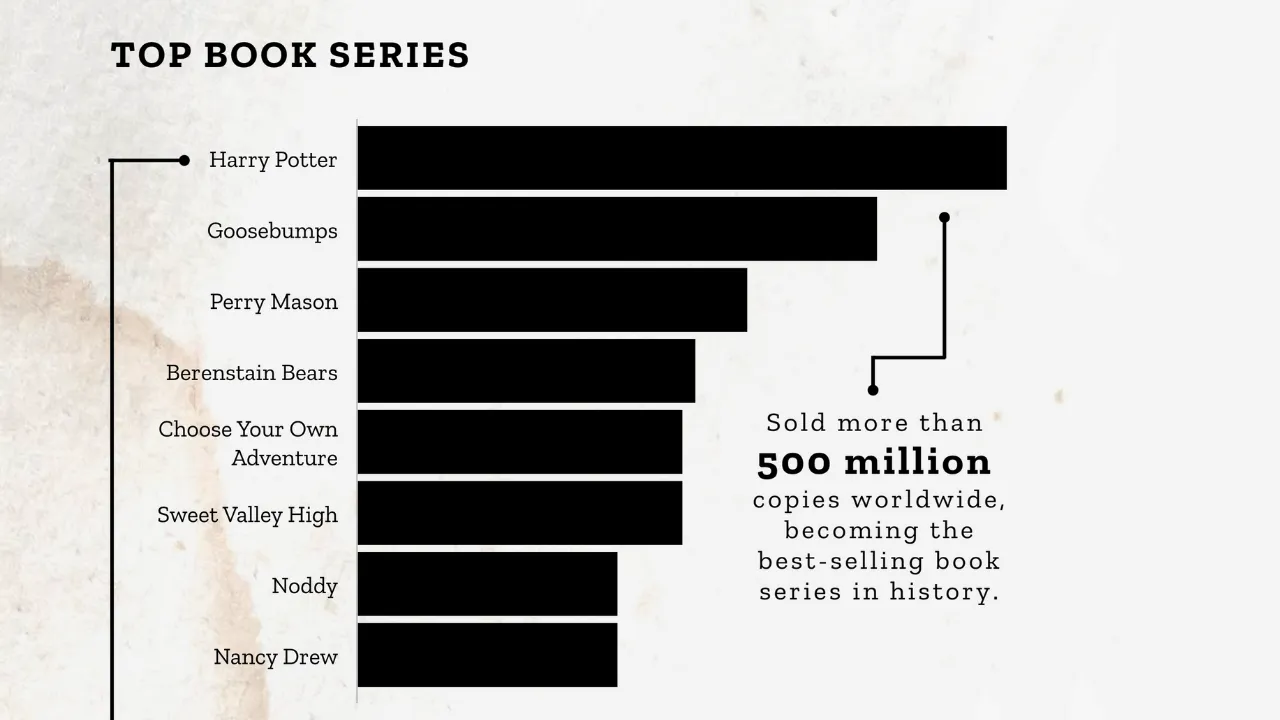
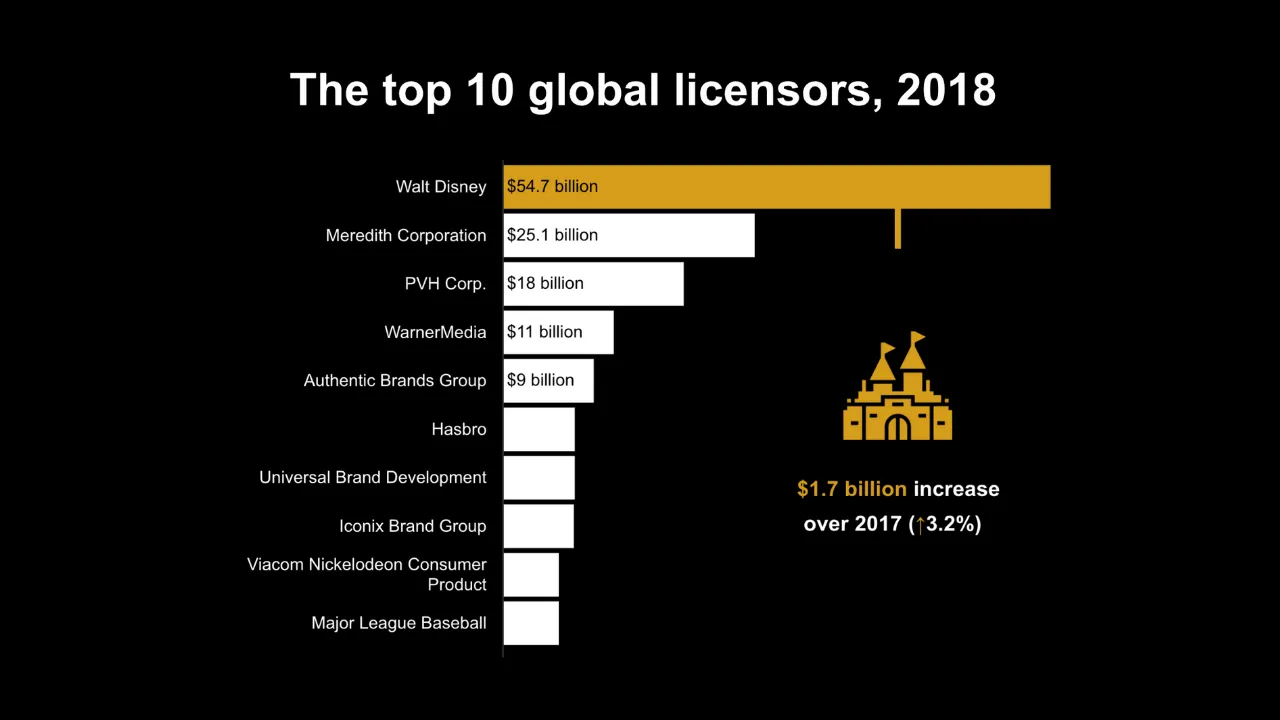
Charts
Slides
Others


Key Features

Interactive & Animated
Make your data stand out with custom tooltips, clickable elements, videos, GIFs, and animations. Interactive visuals boost engagement and make information easier to explore and remember.
Learn more

Share & Embed Anywhere
Easily share or embed your projects on websites, blogs, or presentations - no coding required. Visuals are responsive, optimized for performance, and update automatically when edited.
Learn more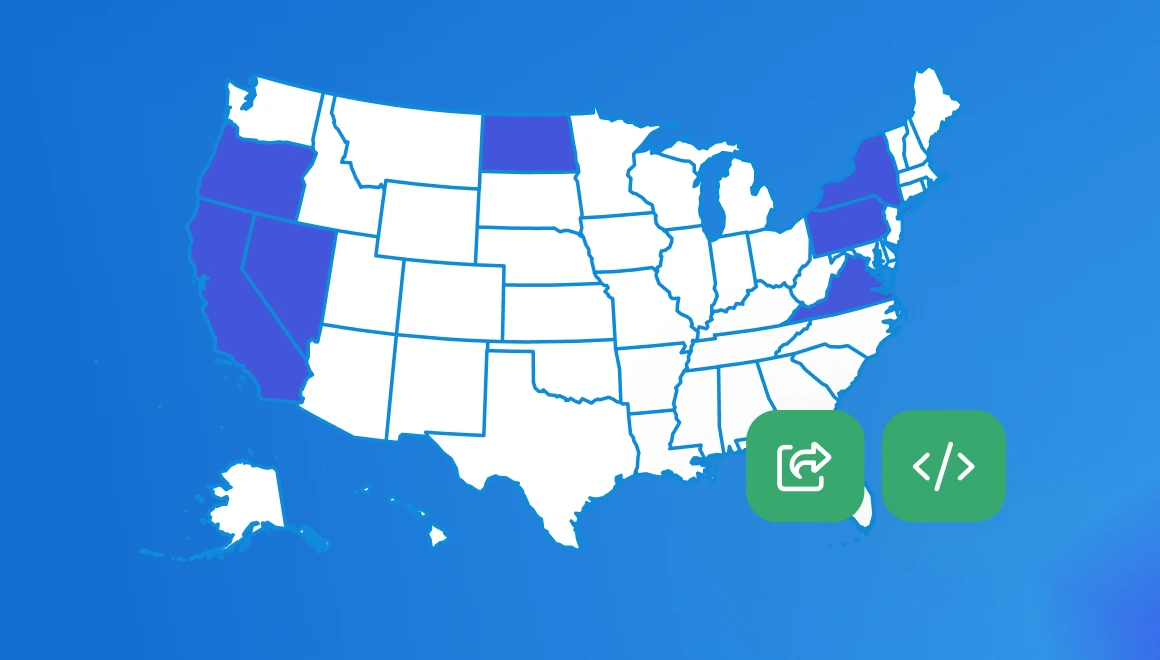

Specialized Charts & Maps Library
Access 35+ customizable chart types and 800+ maps to transform raw data into clear, impactful visuals. Ideal for reports, dashboards, and storytelling across any industry.
Learn more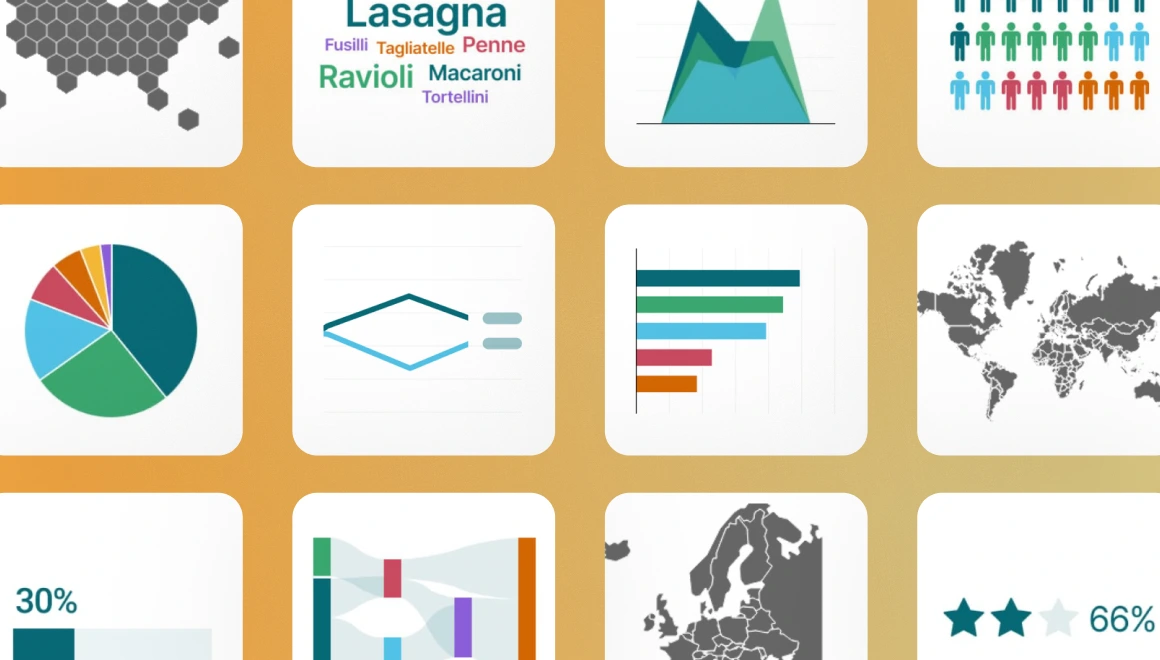

AI-Powered Everything
Infogram’s AI helps you create visuals, suggest charts, adjust content, and convert images into data - all in seconds. Work faster and tell better stories with intelligent automation.
Learn more
and 20+ other features

Brand kit

Custom maps

Data import

API

Accessibility

Content engagement analytics

Custom tooltips

Team templates

Royalty-free asset library

Background remover

Color gradients

Image masking

Color picking

Zoom, bounce, flip or fade

PDF import

Content auto-align

Real time collaboration

MP4 and GIF download
Why Trusted Worldwide

"We didn’t have the time or resources to onboard a new platform, but Infogram’s off-the-shelf API was exactly what we needed."
– Daniel Schneider, Similarweb"
Read case study ›

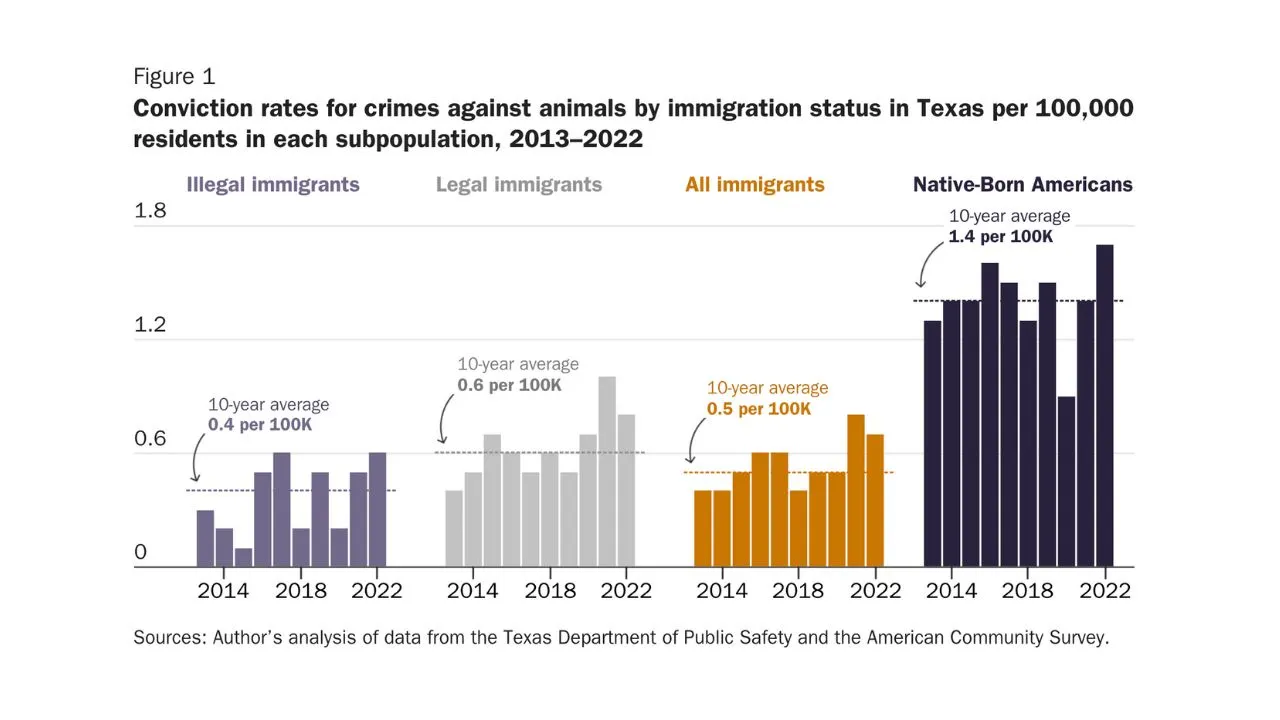
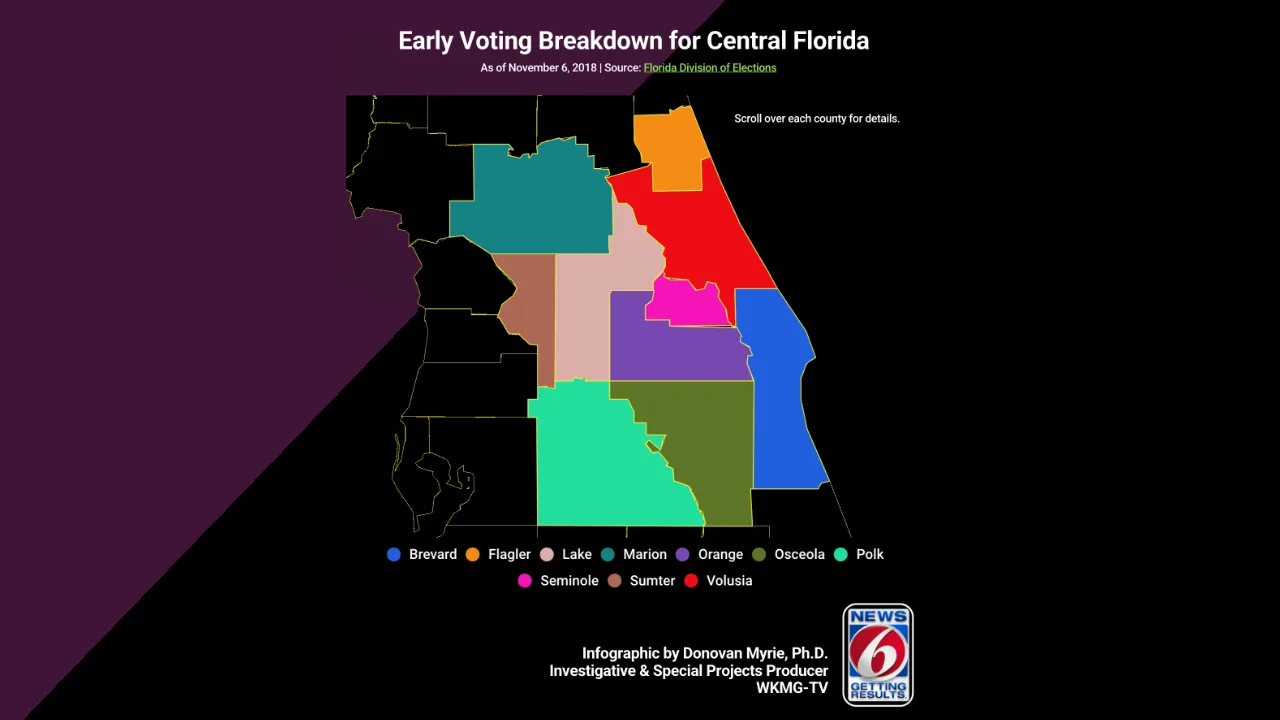
"Infogram has become our benchmark. We’ve seen greater internal adoption, increased viewer engagement, and a smoother workflow for election reporting."
– Donovan Myrie, WKMG News 6"
Read case study ›

"Being able to create high-quality data visualizations in a decentralized way increased our productivity as an organization several-fold since Infogram’s adoption."
– Onur Yoruk, The Cato Institute"
Read case study ›