Improve Navigation with Custom Links
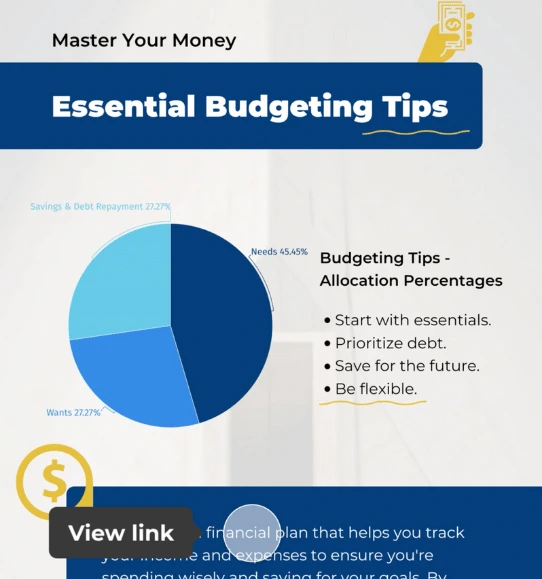
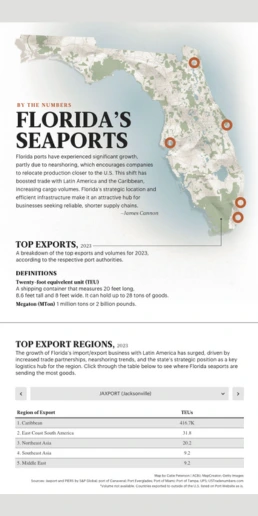
Link tabs of maps and charts to improve interactivity and navigation within dashboards, reports, slides, and other projects.


4.7 out of 5 stars


Overview
Why
Examples
Reviews
Tips
FAQ
Make Complicated Things Simpler
Data visualization projects offer an exciting way to share information effectively. However, people who want to create reports, infographics, dashboards, and slides often run into challenges that can make things tricky. Making these materials requires both creativity and the skill to present complicated data in a way that makes sense to others.
To help with these challenges, Infogram offers a smart solution called custom links. These are like signposts that help you navigate through your materials. Custom links are great because they not only make complex data easier to understand but also make things more interesting and help you move around without any trouble. With custom links, you can click on something and go directly to the most important part, making it simple to grasp tricky information. They also add a cool interactive element to your data, which is much more engaging. Plus, they make it easy to move around your materials, so you don’t have to search a lot.
Another tough part of data visualization is keeping people interested the whole time. Showing insights, trends, and conclusions in an engaging way can be hard. If your visuals don't capture attention, they might not get noticed, and that defeats the purpose of sharing your data. It's really important to find a good balance between giving information and keeping things interesting.
Lastly, when you're working with longer presentations, reports with many pages, or detailed dashboards, things can get confusing. People might get lost as they try to find what they want. Making sure they can get around easily is a big deal. Imagine searching for things in a big pile – it's frustrating. That's where custom links come in handy again. They make it simple to jump to the exact part you're interested in, so you don't have to look everywhere.
In a nutshell, custom links from Infogram are a helpful tool to deal with the challenges of data visualization. They make complicated things simpler, keep people engaged, and help you move around your work without any hassle.
Why You Should Embrace Custom Links in Your Data Visualization
Discover why integrating custom links into your next data visualization project can significantly elevate the user experience and engagement.
Streamline Navigation for Precision
The power of custom links lies in their ability to guide users directly to precise sections, pages, or documents. This efficient feature eliminates the need for tedious scrolling through lengthy content or manual searches, saving users valuable time and effort.
With targeted links, users can effortlessly access the exact information they seek, promoting efficiency and leaving them with a positive impression of your content.

Enhance Content Discoverability
Custom links act as bridges between related pieces of information, offering users a chance to explore additional resources or references. By seamlessly linking relevant content within your data visualization, you create an environment where users can delve deeper into topics of interest.
This method not only enriches users' understanding but also empowers them to access a wealth of knowledge that complements the main narrative.

Elevate the User Experience
A seamless and intuitive navigation experience is paramount for a successful user journey. Custom links contribute to a user-centric browsing encounter by establishing clear pathways between different sections or pages within your visualization.
The convenience of accessing specific information directly fosters engagement and amplifies users' overall satisfaction with your content. As they effortlessly navigate through your data visualization, their experience becomes both enjoyable and enlightening.
By incorporating custom links, you're not only making navigation efficient but also guiding users toward deeper insights, thereby transforming your data visualization project into a dynamic and captivating journey of discovery.
Customer Reviews
Here is what our customers have to say about us.


2022 Summer & Fall and 2023 Winter leader in Data Visualisation Software 4.7 out of 5 stars
See reviews on G2 ›Empowering 30,000+ Companies Worldwide
From startups to established enterprises, our platform has been embraced by a diverse range of businesses seeking to captivate audiences and simplify complex data. Here are just a few examples of the 30,000+ companies that use Infogram.


Learn More Practical Tips
Business
Comprehensive Guide to Creating Annual Business Reports
Data
Exploring Different Types of Reports
Design
18 Surprising Data Visualizations in Your Everyday Life
Design
AI Infographic Generator: Fast, Easy, and Powerful
Design
Different Types of Data Visualizations and When to Use Them
Design
Information Design: Definition, Tips & Examples
Frequently Asked Questions
What custom link opportunities does Infogram offer for its users?
Infogram offers users the ability to add hyperlinks to specific tabs of their maps and charts, enhancing interactivity and navigation within dashboards, reports, and slides.
Who can utilize this feature?
This feature is available to Business, Team, and Enterprise users. More details can be found on the pricing page.
How can I link text objects, graphics, and shapes to tabs within charts and maps?
To link these elements to tabs:
- Select the object.
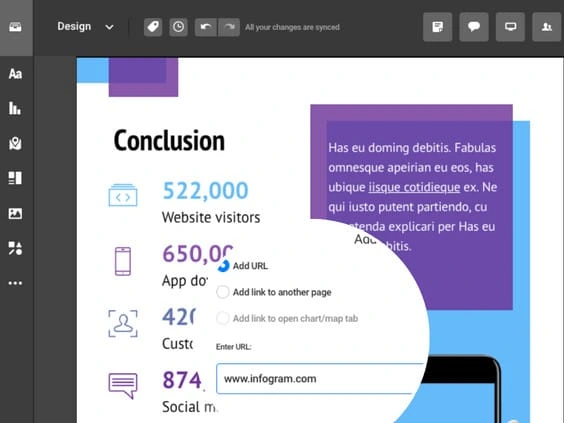
- Click "Add link" in the right settings panel.
- In the pop-up window, choose "Add link to open chart/map tab."
- Select the chart or map from the dropdown menu (maps and charts on the same page).
- Choose the specific tab from the dropdown and click "Apply."
Can I link specific areas/locations of maps and parts of charts to tabs in other charts/maps?
Yes, you can:
- Open the map/chart spreadsheet by double-clicking or clicking "Edit data."
- Right-click the desired cell.
- Select "Add/change link."
- In the pop-up window, choose "Add link to open chart/map tab."
- Select the chart or map from the dropdown.
- Choose the specific tab and click "Apply."
How can I connect charts and maps using their tab names for navigation?
There are two methods:
- While adding a hyperlink, check "Link all project charts by tab name" in the pop-up.
- In the right settings panel (without selecting an object), expand "Viewer experience", and check "Link charts by tab name."
Is there a way to hide tabs on charts and maps?
Yes, you can hide tabs:
- Click on the chart or map.
- Go to "Chart properties" or "Map properties" in the right settings panel.
- Toggle on the "Hide tabs" option.
How does the "Link all project charts by tab name" option work?
Enabling this option ensures that tabs with identical names switch simultaneously as viewers navigate through them.
Can I link different areas/locations within maps and specific parts of charts to tabs?
Yes, you can link specific map areas and parts of charts to tabs in other charts/maps, enhancing cross-navigation and insight sharing.
Are there any benefits to hiding tabs on charts and maps?
Hiding tabs can be beneficial when dealing with multiple charts and maps with added tab links, allowing for a cleaner and more streamlined viewer experience.
Didn't find the answer? Check our FAQs

Try Infogram Now!
Are you ready to unleash the power of data visualization? Get started with Infogram today and create stunning, interactive content that captivates your audience. Elevate your projects and bring data to life.

