
Turn Data into Stories That Drive Results

Create engaging, branded visuals that simplify complex data and captivate your audience - no design skills needed.


4.7 out of 5 stars


Overview
Why
Types
Examples
Reviews
Tips
FAQ
Stand Out in a Crowded Market
As a marketing professional, you need visuals that cut through the noise and deliver insights that drive action. Infogram helps you transform data into interactive charts, maps, and infographics that tell compelling stories. Content marketing managers can turn analytics into engaging infographics to boost reader engagement. Market researchers can visualize survey data for clear, impactful client reports. Event managers can create interactive maps of attendee demographics to impress sponsors. Social media managers can craft animated charts for viral posts, and brand strategists can ensure every visual aligns with campaign guidelines.
Share these visuals on websites, social platforms, or presentations with no coding required. They’re responsive, auto-updating, and branded with your logo and colors, ensuring consistency across channels. Plus you can import data from Excel or databases, and let AI suggest the best chart types to create polished content in minutes. Infogram saves you time, letting you focus on strategy and storytelling that drives engagement and conversions.
6 Reasons Why Marketers Choose Infogram
Discover how Infogram helps marketers craft visuals.

Captivate Audiences on Any Channel
Create interactive visuals like clickable charts or animated maps to engage audiences across websites, social media, or emails. For example, a social media manager can share an animated infographic showing campaign reach on Instagram, while an event manager can embed a clickable venue map in a newsletter.
With 35+ chart types, 800+ maps, and animations like zooms or fades, Infogram boosts shares and retention. Content engagement analytics show what resonates, helping you optimize for impact.

Simplify Complex Data for Stakeholders
Turn dense datasets into clear visuals that anyone can understand. A market researcher can create a bar chart of consumer trends for a client deck, while a content marketing manager can visualize blog performance for a team meeting.
AI-powered chart suggestions and data imports from PDFs or spreadsheets save time. Custom tooltips add hover-over explanations, ensuring clarity for stakeholders or customers.

Keep Your Brand Consistent
Ensure every visual reflects your brand with Infogram’s brand kit, applying logos, colors, and fonts across projects. A brand strategist can create cohesive campaign visuals, while a content marketing manager can align infographics with brand guidelines.
Features like color picking, image masking, and royalty-free assets from Unsplash or Giphy add polish. This builds trust and strengthens brand recognition across all touchpoints.

Collaborate Across Teams
Streamline teamwork with real-time collaboration, perfect for fast-paced marketing projects. A content marketing manager can work with a market researcher to build a dashboard, while an event manager shares templates with vendors for promo materials.
Team templates and commenting keep everyone aligned, even remotely, saving time and ensuring consistent quality.

Share Visuals Effortlessly
Embed visuals in websites, emails, or presentations without coding. Auto-updating charts keep your campaign dashboards or client reports current, ideal for a market researcher sharing live survey results or a social media manager updating a performance tracker.
Responsive designs look great on any device, and MP4 or GIF downloads make sharing on social media a breeze.

Save Time with AI Tools
Infogram’s AI handles repetitive tasks, letting you focus on strategy. It suggests chart types, converts images to data, or localizes content for global campaigns. A social media manager can quickly turn analytics into visuals, while an event manager can create sponsor reports in minutes.
Features like content auto-align and background remover ensure professional results without design expertise.
Explore Most Loved Features

Image Background Removal
Remove unnecessary backgrounds from images with a simple click. Cut out objects, create photomontages, and more.

Chart Library
Choose from a diverse range of chart types in Infogram's extensive library. Customize colors and labels to present your data in a visually compelling way, making complex information easily understandable.

Map Library
Visualize geographic data effectively with Infogram's map library. Select from various map styles and formats to enhance the impact of your storytelling and showcase regional insights.

Data Import
Effortlessly import data from various sources into Infogram, ensuring accurate and up-to-date visualizations for your reports. Streamline your data management process and focus on analyzing insights.

Annotations and Callouts
Add explanatory text, highlights, and insights to your data visualizations with Infogram's annotation and callout features. Provide context and enhance audience understanding of your nonprofit's impact.

Real-Time Collaboration
Collaborate seamlessly with your team members, editors, and contributors in real-time. Share projects, leave comments, and track changes, facilitating efficient teamwork and content creation.

Auto-Aligning Content
Simplify the layout of your projects with Infogram's auto-align feature. With just a click, you can easily change the alignment of objects on your canvas, enabling you to create image galleries or dashboards with ease.

Project Embeds
Enhance your website or blog with interactive visualizations by seamlessly integrating them through Infogram's project embeds. Create an engaging and immersive experience for your audience.

Brand Kit
Ensure consistent branding across all your projects with Infogram's brand kit. Effortlessly upload and apply your nonprofit's logos, color schemes, and fonts to maintain a cohesive visual identity.

Content Engagement Analytics
Gain valuable insights into audience behavior and engagement with Infogram's comprehensive analytics. Refine your content strategy based on real-time feedback, ensuring maximum impact and resonance.
Get Inspired by Infogram User Created Projects

Marvels Movies Binge-Watch the Right Way

Halloween Shopping Season

A Different Kind of March Madness
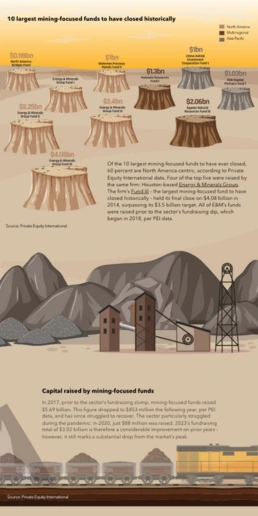
10 Largest Mining-Focused Funds to Have Closed Historically

Health to the plants

A snapshot of greater Portland's need for affordable homes

A Different Earth Day

10 Wins You Made Happen
Customer Reviews
Here is what our customers have to say about us.
2022 Summer & Fall and 2023 Winter leader in Data Visualisation Software 4.7 out of 5 stars
See reviews on G2 ›Empowering 30,000+ Companies Worldwide
From startups to established enterprises, our platform has been embraced by a diverse range of businesses seeking to captivate audiences and simplify complex data. Here are just a few examples of the 30,000+ companies that use Infogram.


Learn More Practical Tips
Data
Introducing Interactive Square and Hexagon Maps
Marketing
Brand storytelling: 4 brand story examples to inspire you
Marketing
Data storytelling: Ingredients to an effective data story
Organizations
The ultimate nonprofit marketing guide: Strategies and tools for success
Marketing
Social media trends to expect in 2023
Sales
How to effectively engage prospects with your sales presentation
Frequently Asked Questions
How does Infogram help marketers create compelling visuals?
Infogram offers 35+ chart types, 800+ maps, and AI-driven tools to turn data into interactive stories. For example, a content marketing manager can create an infographic for a blog, while a market researcher can build a dashboard for client insights, all without design skills.
Why is interactive content valuable for marketing?
Interactive visuals like clickable charts or animated maps increase engagement, encourage sharing, and make data memorable. They let audiences explore insights at their own pace, boosting retention and strengthening brand loyalty.
How do I create interactive content with Infogram?
Choose a template or start fresh, add charts, maps, or animations, and customize with your data and branding. AI suggests layouts, and features like custom tooltips or animations make your visuals engaging and professional.
Can my team collaborate using Infogram?
Yes, real-time collaboration lets teams edit visuals, share templates, and provide feedback instantly. A social media manager can work with a brand strategist to ensure visuals align with campaign goals, even remotely.
How does Infogram simplify sharing visuals?
Embed visuals in websites, emails, or presentations with no coding. Auto-updating, responsive designs keep your content current and professional across platforms, perfect for live campaign updates or client reports.
What are content engagement analytics, and how do they help?
Analytics track audience interactions like clicks or shares, showing what drives engagement. A market researcher can use these insights to refine reports, while a social media manager can optimize posts for better performance.
How does Infogram ensure brand consistency?
Infogram’s brand kit lets you apply logos, colors, and fonts across all visuals. Features like color picking and image masking ensure every chart or infographic aligns with your brand, building trust and recognition.
Can Infogram save time for busy marketers?
Yes, AI tools suggest chart types, convert images to data, and localize content, while features like content auto-align and PDF import streamline design. This lets you create professional visuals quickly, freeing time for strategy.
How does Infogram support accessibility in marketing campaigns?
Infogram’s visuals are screen-reader friendly, ensuring inclusivity for all audiences. This helps marketers reach broader demographics and comply with accessibility standards in campaigns or reports.
Didn't find the answer? Check our FAQs

Try Infogram Now!
Are you ready to unleash the power of data visualization? Get started with Infogram today and create stunning, interactive content that captivates your audience. Elevate your projects and bring data to life.