Create Interactive Data Visualizations with AI


Experience the Power of Interactivity

Tell a story with dynamic elements and tooltips that users can explore. Tell a story with dynamic elements and tooltips that users can explore.

Tell a story with dynamic elements and tooltips that users can explore. Tell a story with dynamic elements and tooltips that users can explore.

Integrate projects into websites or share as MP4, allowing viewers to interact directly.

Breathe new life into existing projects by importing them and adding interactive elements.
Explore Endless Data Possibilities

Explore over 35 charts and 800+ map types with different styles.

Keep your visualizations fresh with auto-updating data for real-time insights.

Connect to a wide range of data sources like MySQL, and PostgreSQL, or easily upload your own files.
Access Pro Editing Features

Access a diverse range of premium visual assets including photos, videos, stickers, gifs, and more.
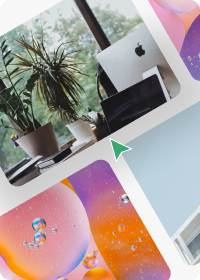

Effortlessly remove image backgrounds to focus on specific elements.


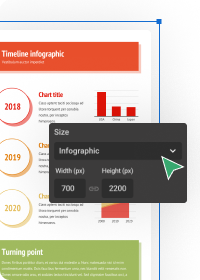
Resize project size and layout instantly with a single click.

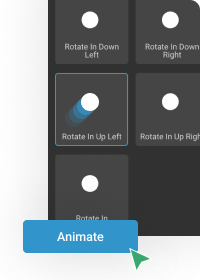
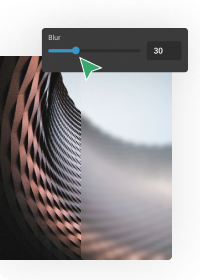
Apply subtle effects for a seamless and professional appearance.

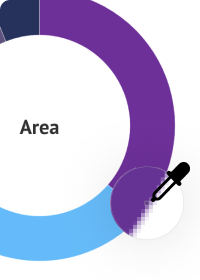
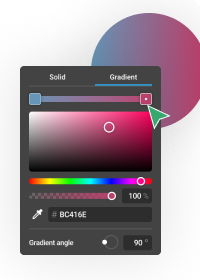
Easily select and match colors using the eye-drop color picker.

Apply gradient effects to text and project backgrounds.

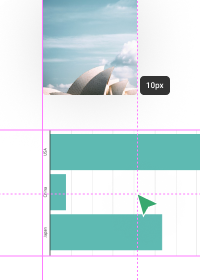
Align objects on your canvas with a simple click.

Create unique visual compositions by overlaying patterns or shapes on images.


Enhance visuals with various filters and effects.
Elevate Your Workflow with AI

Skip the design struggle. Enter your topic, data, or text, and watch our AI craft stunning infographics in moments.

Skip the design struggle. Enter your topic, data, or text, and watch our AI craft stunning infographics in moments.

No design expertise needed. Input your data and let AI generate the perfect chart or graph for clear communication.

Optimize your content with AI assistance. Shorten or lengthen text or automatically generate bullet points for improved readability.
Perfect for Teams Too

Establish a brand kit to ensure consistent use of your brand logo, color schemes, and fonts across all projects.

Establish a brand kit to ensure consistent use of your brand logo, color schemes, and fonts across all projects.

Access reports on content performance, including viewer demographics and content-sharing metrics.

Seamlessly collaborate in real-time with team members, editors, and contributors.
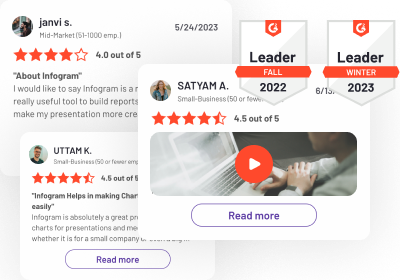
Trusted by 10M+ Users Worldwide
From global enterprises to students and individuals, millions rely on Infogram to transform data into compelling visuals.
