
Simplify Project Management with Gantt Charts
Visualize your tasks, track dependencies, and keep your team aligned with our interactive Gantt charts.


4.7 out of 5 stars


Overview
Why
Examples
Reviews
Tips
FAQ
Simplify Project Management with Gantt Charts
In the world of project management, handling complex projects can be a bit tricky. You've got tasks to juggle, tasks that depend on each other, progress to track, and resources to manage – all at the same time. It can get overwhelming! But here's where Infogram's Gantt charts step in to help you out. They're like your project management sidekick, turning the complicated into something more manageable.
Gantt charts in Infogram are super handy for dealing with the challenges that often pop up in project management. They give you a clear picture of how tasks are connected and how long they'll take. You can easily see which tasks need to happen before others and get a sense of the whole timeline. This makes it much easier to organize tasks and avoid any roadblocks along the way.
Staying up-to-date and keeping everyone on the same page can be a struggle too. Sometimes, sharing updates takes time and messages get lost. But with Infogram's Gantt charts, that's no longer a headache. You can see real-time updates right on the chart. This means you'll always know how things are progressing, and your team will be in the loop too. It's like having a communication hub that keeps everyone on track.
Balancing work among your team members can also be tough. You want to make sure everyone has the right tasks and nobody is overloaded. That's where Gantt charts shine again. They show you who's working on what and when. This helps you assign tasks smartly and make sure everyone's workload is just right. Plus, your team members can see their tasks clearly, making them feel more connected and responsible.
Explore Why Gantt Charts Are Useful
Explore visual storytelling and learn why Gantt charts are crucial.

Clear Project Planning and Progress Tracking
Gantt charts enable users to meticulously plan and track project timelines. With visually represented tasks and their durations, users can create a comprehensive overview of project phases and dependencies. This aids in setting realistic expectations, allocating resources effectively, and ensuring that the project stays on course.
As tasks are completed and progress is updated, users can instantly gauge how the project is advancing, helping them stay aligned with project goals and milestones.

Visual Storytelling of Data and Tasks
Gantt charts empower users to transform complex data and task structures into visually engaging narratives. By employing interactive elements, annotations, and colors, users can convey intricate details in an easily understandable format. This is particularly advantageous when sharing project updates with stakeholders, team members, or clients.
The ability to encapsulate data-driven insights within a single, visually captivating chart fosters effective communication, ensuring that all involved parties grasp the project's status, direction, and nuances.

Enhanced Collaboration and Decision-Making
Gantt charts facilitate seamless collaboration among project teams. By providing a centralized platform for task assignments, progress updates, and timeline visualization, Gantt charts promote transparency and accountability. Team members can identify potential bottlenecks, allocate resources wisely, and adapt to changes promptly.
Moreover, stakeholders can gain real-time insights into project advancements, making informed decisions and addressing issues proactively. This collaborative approach improves project efficiency, minimizes risks, and fosters a cohesive team environment.
Get Inspired by Infogram User Created Projects
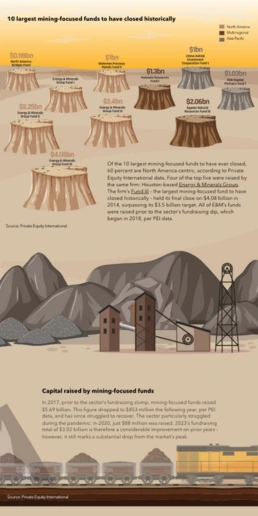
10 Largest Mining-Focused Funds to Have Closed Historically

Health to the plants

Automation & jobs

10 Plus Grands Fonds Axés sur l’Extraction Minière Fermés Historiquement

10 Largest Mining-Focused Funds to Have Closed Historically

Customer Survey Report

The Not Enough Impact Report 2018

The Impact of the Better Care Reconciliation Act on Employment
Customer Reviews
Here is what our customers have to say about us.
2022 Summer & Fall and 2023 Winter leader in Data Visualisation Software 4.7 out of 5 stars
See reviews on G2 ›Empowering 30,000+ Companies Worldwide
From startups to established enterprises, our platform has been embraced by a diverse range of businesses seeking to captivate audiences and simplify complex data. Here are just a few examples of the 30,000+ companies that use Infogram.


Learn More Practical Tips
Business
Best Ways to Visualize and Analyze Polling Data
Design
18 Surprising Data Visualizations in Your Everyday Life
Finance
A Practical Guide to Creating Financial Reports
Business
Comprehensive guide to creating annual business reports
Design
Data visualization trends you should look out for in 2023
Design
Information design: definition, tips & examples
Frequently Asked Questions
How do I register an account?
- Click on the Get started button in the top right corner of the homepage.
- Sign up with Google, Facebook or email. Infogram lets its users sign up with a Google or Facebook account, or register with a work email. If you choose to sign up with Google or Facebook, simply login to your account when asked to do so. If you wish to sign up with your email address, enter the email and your desired password, then hit the sign up button.
- Provide some basic information about yourself. Enter your first and last name, indicate what kind of organization you belong to and specify your role. You will then be able to continue with the Basic plan or choose from any of the available paid plans.
Where to use interactive Gantt charts?
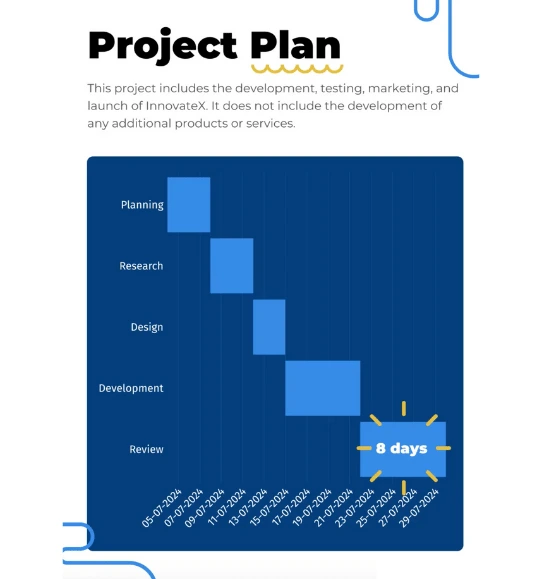
Gantt charts are commonly used for project management and act as a quick and easy way to display tasks and activities along a timetable. You may use a Gantt chart to display key activities on a timeline, schedule how long activities are going to last, or show start and end dates for specific activities.
Gantt charts are also used in project management when multiple team members are involved. They quickly show who is working on which part of a project and how much of it they’ve completed. They provide a great visual to help teams understand how tasks overlap, group together, and link with one another.
Keep team members on task and help them understand in one easy visual how every task comes together and how each piece is integral to the completion of a project by using an interactive Gantt chart.
What are some common types of Gantt charts and how do they differ?
Several types of Gantt charts are commonly used to visualize project schedules and tasks, each with its own focus and purpose.
- Standard Gantt Chart: The most common type, it represents tasks as horizontal bars along a time axis, indicating their durations. Dependencies between tasks are shown with arrows, making it effective for illustrating project schedules and task relationships.
- Milestone Chart: A simplified version, it highlights key project milestones or events with vertical markers on the timeline. It's useful for emphasizing critical deadlines and major achievements without delving into detailed tasks.
- Summary Gantt Chart: Providing a high-level view, it consolidates subtasks or subprojects into summary tasks. This is beneficial for top-level project planning, especially for complex projects with multiple task levels.
- Baseline Gantt Chart: This represents the original project schedule before updates. It's used as a reference point to compare actual progress, aiding in tracking deviations, delays, and project performance.
- Resource Gantt Chart: Focusing on resource allocation, it displays tasks, timelines, and the resources assigned to each task. It helps visualize resource usage, identify allocation issues, and optimize resource distribution.
- Critical Path Method (CPM) Gantt Chart: Highlighting the critical path—tasks that impact project duration—it helps managers focus on essential tasks. It often uses distinct formatting or colors to emphasize these critical elements.
These Gantt chart types cater to different project needs and information communication, allowing project managers to select the most appropriate one based on requirements and stakeholder needs.
How do I create a Gantt chart?
You can make a Gantt chart in 5 simple steps:
- Log in to Infogram.
- Select the Gantt chart from the chart menu.
- Upload or copy and paste your data.
- Customize labels, colors, and fonts.
Download your Gantt chart as an image or embed it on your website.
How do I change chart colors?
When it comes to using colors in charts, try to keep it simple. A good rule of thumb is the 60-30-10 principle: Use a primary color that dominates 60% of your project area, a secondary color that takes up 30% of the project to visualize important data, and a third accent color that draws particular attention to 10% of your data.
To change the colors used in your chart:
- Click to select your chart, then expand the Color drop-down in the right sidebar.
- Disable the Use one color option to choose a color for each variable. Click on the color boxes to choose the color by using the color picker or entering a hex code.
Note: Switching to a different project theme in the right sidebar will switch all colors for all charts/objects in your project and provide a list of template-matching colors to choose from. We even offer a colorblind-friendly theme!
Pro tip: To avoid having to change chart colors each time to your company’s brand colors, we can develop a custom project theme for your company with your corporate colors, fonts, logos, icons, etc. This way, your content becomes easily scalable and reusable. This is a feature available to our Enterprise customers. Read more here. To change the colors used in the chart's legend and axis, expand the Fonts tab in the right sidebar.
How do I format the date in Gantt and candlestick charts?
Gantt and candlestick charts contain a date-based X-axis that allow you to choose the format that suits you best: YMD, DMY, and more. (Y – year, M – month, D – day)To select a different axis date format:
- Click to select the chart.
- Open the Axis & Grid tab in the right side settings panel.
- Under X-axis time format, choose any of the available options.
How do I edit chart settings?
Customize charts to look just the way you want them to! Chart settings are located in the right sidebar of the editor. After adding a chart to your project, select it once to access chart settings. Use tabs at the top to switch between the data table and settings. Here you can add animations to your chart, as well as edit (click on the hyperlinked settings to be redirected to tutorial articles):
- Chart properties
- Color
- Axis and grid
- Fonts
- Legend
- Tooltips
- Data format
- Accessibility
Pro tip: To copy the style of one chart and paste it onto another, right-click on the chart, select the style you wish to copy, and click Copy style, then right-click on the chart on which you want to paste the style, and click Paste style. Read more on copying styles in our support article.
How do I add text?
Give your projects a sense of structure by using text elements with predefined styles and a typographic hierarchy. This will allow your audience to navigate and understand your ideas more effectively.
To add text:
- From the project editor, click on the Add text button on the left-side toolbar.
- Choose a text element, then drag and drop it onto the canvas.
These are the available text element options:
- Title: Used as a primary heading to name the project.
- Subtitle: Used as a secondary heading to name sub-sections in your project.
- Body text: Usually the most-read text element on the page. Make sure to derive other text element sizes from the body text size.
- Caption text: Highlights the essence of a chart or map. Captions can be written in just a few words or a few sentences. Keep it short to make it most effective.
- Quote: A reproduction of what another person said or wrote. For example, use quotes to convey customer reviews.
- Facts & figures and Centered fact and figure: Both elements are text-based charts with icons. Best used to highlight interesting facts.
- Table chart: A great option for displaying data with both textual and numeric columns. Read more about it here.
Check out our other articles to see how to edit and resize text objects, as well as add graphic elements that contain text.
How do I undo/redo an action?
To undo or redo any edits in your project, simply use the arrow buttons in the toolbar just above your project. The left arrow allows you to undo and revert to a previous version of your project. The right arrow allows you to redo any edits. You can click the arrows several times to go back to where you started or to where you finished. You can also use keyboard controls ⌘ + Z (on Mac) or Ctrl + Z (on Windows) to undo.
Note: Remember that after exiting or closing the project editor, the action history will be lost (unless you have a business, team, or enterprise account) If you have started your project by clicking on the Responsive web and mobile layouts shortcut, after you delete a chart, map, text field, or any other object from your report, a message will appear in its place allowing you to undo the last action. No other action history is available when working with Responsive web and mobile layouts!
Didn't find the answer? Check our FAQs

Try Infogram Now!
Are you ready to unleash the power of data visualization? Get started with Infogram today and create stunning, interactive content that captivates your audience. Elevate your projects and bring data to life.