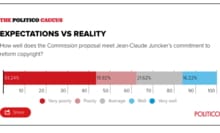
 Bar charts
Bar charts are graphs with rectangular bars plotted horizontally with lengths proportional to the values they represent. They are mostly used to display and compare discrete categories of data. Bar charts are easy to understand and simple to create. There are several variations including grouped and stacked bar charts.
Start your first projectLearn how to create a bar chartBrowse examples
Browse chart types


