
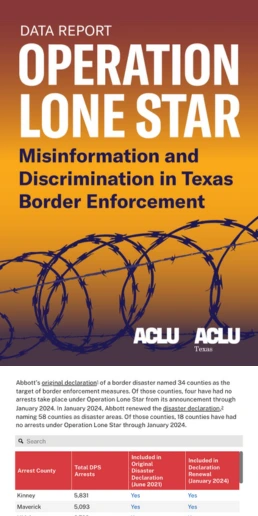
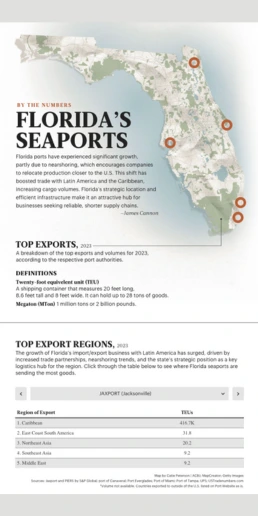
Elevate Storytelling with Local Maps
Create context-rich visualizations! Use local maps and explore data patterns in specific regions.


4.7 out of 5 stars


Overview
Why
Examples
Reviews
Tips
FAQ
Enhance Your Data Storytelling with Local Maps
When it comes to creating engaging data-driven stories, local maps can be your best ally for bringing geographic data to life. By combining your data with local maps, you provide your audience with a clear geographical context and add valuable insights to your narrative.
Infogram's local mapping feature empowers you to elevate your data storytelling to new heights. Whether you're focusing on specific regions or local areas, our user-friendly tool makes uploading your own maps online a breeze. It supports various file formats like JSON, GeoJSON, KML, and TopoJSON, and you have the flexibility to upload local maps online, even up to 10MB in size. This gives you the freedom to create intricate and precise visualizations that reveal patterns and trends like never before.
Say goodbye to the limitations of standard mapping solutions. With Infogram's local mapping feature, you can break free and unlock your data storytelling's full potential. We understand the importance of precision and adaptability when working with specific regions and local areas. Our seamless local mapping feature effortlessly integrates your own local maps online into your visualizations, making data presentation a smooth and precise process.
Whether you're visualizing demographics, tracking market trends, or mapping out survey results, local maps offer endless possibilities for businesses, researchers, and data analysts. Discover unique insights tailored to your local context and make informed, data-driven decisions. Ready to take your data storytelling to the next level? Start using Infogram's local mapping feature today and captivate your audience with visually compelling and context-rich local maps online.
3 Reasons to Try Infogram Local Maps
Discover the reasons why you should try Infogram and revolutionize your visual content.
Tailored Visualizations
Infogram's local maps feature allows you to create visualizations that are perfectly tailored to your specific requirements. No longer confined to pre-made maps, you can work with your own local maps to ensure that your data is accurately portrayed in the right places.
Customize the map style, incorporate additional layers, or spotlight specific areas to craft visualizations that precisely represent your data and effectively convey your intended message.
Pinpoint Accuracy
Our local maps enable you to precisely map your data to the locations that are most critical to your analysis. By aligning your data with the geography that matters most to your project, you gain a deeper understanding of patterns and trends, empowering you to make more precise, informed decisions.
Whether you're examining sales data in specific neighborhoods or tracking the spread of a disease in local communities, custom maps online provide the spatial context necessary to unveil valuable insights and drive impactful actions.
Perfect for Localized Scenarios
For scenarios involving local maps that aren't readily available in our general map library, our map upload feature is the ultimate solution. Whether you're analyzing specific neighborhoods, regions, or localities, you can seamlessly upload your own custom maps online to accurately depict the locations that are most relevant to your work. This ensures that your visualizations align precisely with the geographical context of your data, delivering the most accurate representation possible.
By leveraging local maps, you can dive into hyper-local analysis, uncovering insights that are unique to your specific location or region. This level of granularity empowers you to make data-driven decisions that are finely tuned to the local factors impacting your business or research.


Customer Reviews
Here is what our customers have to say about us.
2022 Summer & Fall and 2023 Winter leader in Data Visualisation Software 4.7 out of 5 stars
See reviews on G2 ›Empowering 30,000+ Companies Worldwide
From startups to established enterprises, our platform has been embraced by a diverse range of businesses seeking to captivate audiences and simplify complex data. Here are just a few examples of the 30,000+ companies that use Infogram.


Learn More Practical Tips
Design
Map Customization: 3 Essential Learnings to Bring Stories to Your Maps
Design
What Is a Choropleth Map and How to Create One With Infogram
Marketing
5 Tips on Writing Online Articles That People Actually Want to Read
Marketing
Data Storytelling: Ingredients to an Effective Data Story
Media
Essential Data Journalism Skills for Every Data Journalist
Media
Your Guide to Interactive Electoral Maps
Frequently Asked Questions
Why and how to create local maps?
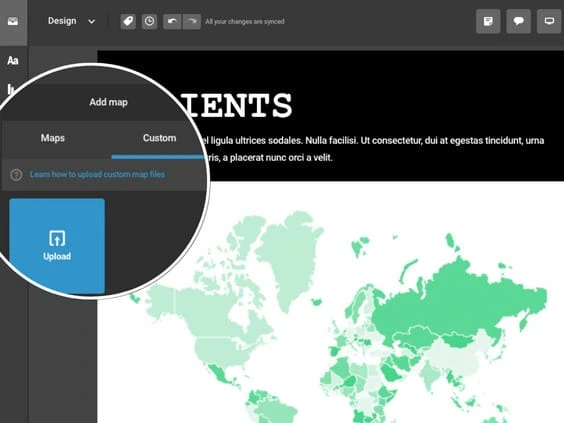
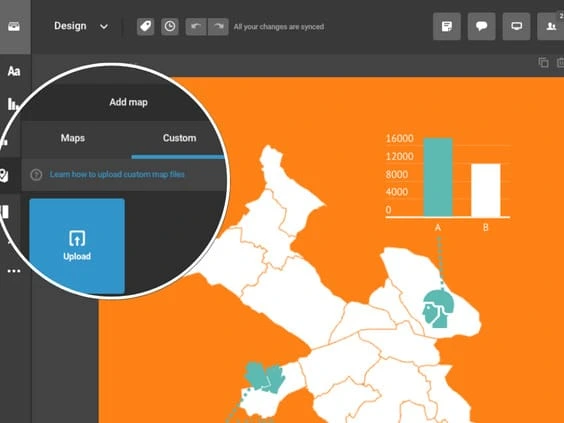
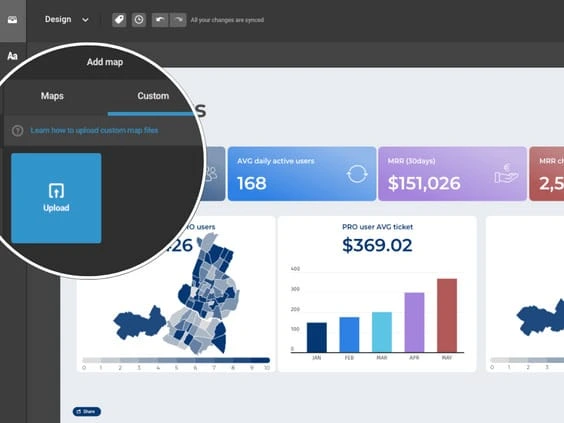
Sometimes, standard map solutions may not offer the level of detail required to effectively present your data. For instance, when reporting sales results for specific LATAM countries or election outcomes for local districts, you need maps that are more customized and precise. Infogram provides the solution by allowing you to create your own local maps.To use local maps, you'll need an InfogramEnterprise plan, which enables collaborative map creation for multiple projects, saving you time and effort.The process for creating custom maps with Infogram is straightforward:
- Upload your custom map files to your library, selecting from file formats like JSON, GeoJSON, KML, or TopoJSON.
- Configure map parameters, including ID, labels, and groups.
- Design and customize your map to align with your unique requirements and preferences.
Once you've uploaded or chosen a custom map from our gallery, you can let your creativity flow by customizing the map's design and settings to suit your needs.
What file formats are supported for custom map uploads?
Our custom map upload feature supports various file formats, including JSON, GeoJSON, KML, and TopoJSON. You can upload maps in these formats to accurately visualize your data. Please note that this feature is exclusively available for our enterprise-level customers.
Is there a file size limit for custom map uploads?
Yes, there is a maximum file size limit for custom map uploads, which is 10MB. Ensure that your map files are within this limit to make full use of the custom map upload feature.
Is the custom map upload feature available to all Infogram users?
No, the custom map upload feature is exclusively accessible to our enterprise-level customers. If you want to utilize this powerful feature, consider upgrading to our enterprise plan.
What are the best practices for creating custom maps?
When creating custom maps, it's important to follow these best practices:
- Choose the map type that aligns with your project's goals, whether it's an area map for showing distributions within larger regions or an icon map for highlighting specific locations.
- Customize maps with a clean and appealing design. Utilize Infogram's editing features to select suitable text fonts, sizes, layouts, legend styles, and color schemes. Ensure that the map design aligns with your company's branding.
- Go beyond the map borders by experimenting with different output formats, such as downloading the map project in various formats or embedding it on the web. Enhance user engagement by using callouts to provide additional context and consider creating infographics that combine maps with charts, tables, text, images, and more for a comprehensive storytelling experience. Simplicity and clarity are key to avoid overwhelming visualizations.
Didn't find the answer? Check our FAQs

Try Infogram Now!
Are you ready to unleash the power of data visualization? Get started with Infogram today and create stunning, interactive content that captivates your audience. Elevate your projects and bring data to life.